Bordetella phage CN2
Taxonomy: Viruses; Duplodnaviria; Heunggongvirae; Uroviricota; Caudoviricetes; Caudovirales; Siphoviridae; Vojvodinavirus; Bordetella virus CN2
Average proteome isoelectric point is 6.15
Get precalculated fractions of proteins

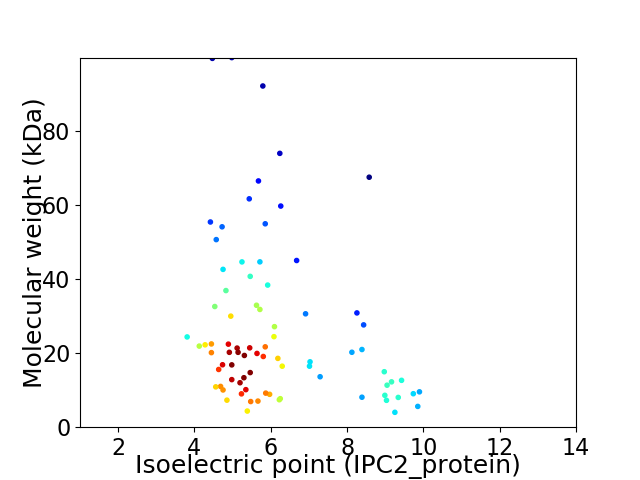
Virtual 2D-PAGE plot for 81 proteins (isoelectric point calculated using IPC2_protein)
Get csv file with sequences according to given criteria:
* You can choose from 21 different methods for calculating isoelectric point
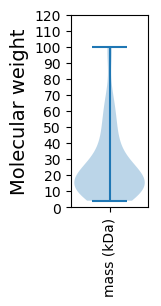
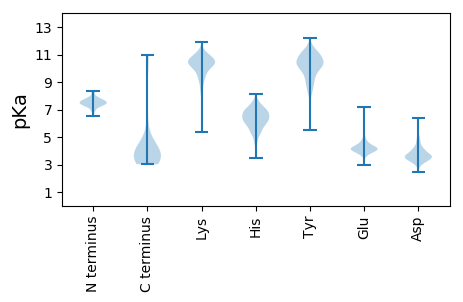
Summary statistics related to proteome-wise predictions


Protein with the lowest isoelectric point:
>tr|A0A2D0W9F7|A0A2D0W9F7_9CAUD Virion structural protein OS=Bordetella phage CN2 OX=1916124 PE=4 SV=1
MM1 pKa = 7.92DD2 pKa = 6.08PEE4 pKa = 4.47NLPPPIATLGPDD16 pKa = 3.0VTFYY20 pKa = 11.54DD21 pKa = 4.63DD22 pKa = 4.11GDD24 pKa = 3.83VTEE27 pKa = 4.81GLTYY31 pKa = 9.98YY32 pKa = 10.72YY33 pKa = 10.51RR34 pKa = 11.84VGAFNAARR42 pKa = 11.84EE43 pKa = 4.36VVSAEE48 pKa = 4.13LEE50 pKa = 4.21APADD54 pKa = 3.99PNVSQARR61 pKa = 11.84IIWRR65 pKa = 11.84ILIQDD70 pKa = 3.53TRR72 pKa = 11.84SGDD75 pKa = 4.01EE76 pKa = 3.92YY77 pKa = 11.19ACWVSEE83 pKa = 3.44IKK85 pKa = 9.99MRR87 pKa = 11.84VLGGPNLAVDD97 pKa = 4.74GLASASSFYY106 pKa = 10.2STPDD110 pKa = 2.63DD111 pKa = 3.84WGPGRR116 pKa = 11.84AFDD119 pKa = 4.73GSPATGWSSNSGAPLPQWIAYY140 pKa = 7.34EE141 pKa = 4.13LTSPAALTEE150 pKa = 3.9ISIQAGNNAGRR161 pKa = 11.84AARR164 pKa = 11.84APRR167 pKa = 11.84TFQIQSSMDD176 pKa = 3.11GTIWEE181 pKa = 4.51TRR183 pKa = 11.84FTATDD188 pKa = 3.63EE189 pKa = 4.42PAWDD193 pKa = 3.94PGEE196 pKa = 3.78IRR198 pKa = 11.84TYY200 pKa = 10.35TFF202 pKa = 3.32
MM1 pKa = 7.92DD2 pKa = 6.08PEE4 pKa = 4.47NLPPPIATLGPDD16 pKa = 3.0VTFYY20 pKa = 11.54DD21 pKa = 4.63DD22 pKa = 4.11GDD24 pKa = 3.83VTEE27 pKa = 4.81GLTYY31 pKa = 9.98YY32 pKa = 10.72YY33 pKa = 10.51RR34 pKa = 11.84VGAFNAARR42 pKa = 11.84EE43 pKa = 4.36VVSAEE48 pKa = 4.13LEE50 pKa = 4.21APADD54 pKa = 3.99PNVSQARR61 pKa = 11.84IIWRR65 pKa = 11.84ILIQDD70 pKa = 3.53TRR72 pKa = 11.84SGDD75 pKa = 4.01EE76 pKa = 3.92YY77 pKa = 11.19ACWVSEE83 pKa = 3.44IKK85 pKa = 9.99MRR87 pKa = 11.84VLGGPNLAVDD97 pKa = 4.74GLASASSFYY106 pKa = 10.2STPDD110 pKa = 2.63DD111 pKa = 3.84WGPGRR116 pKa = 11.84AFDD119 pKa = 4.73GSPATGWSSNSGAPLPQWIAYY140 pKa = 7.34EE141 pKa = 4.13LTSPAALTEE150 pKa = 3.9ISIQAGNNAGRR161 pKa = 11.84AARR164 pKa = 11.84APRR167 pKa = 11.84TFQIQSSMDD176 pKa = 3.11GTIWEE181 pKa = 4.51TRR183 pKa = 11.84FTATDD188 pKa = 3.63EE189 pKa = 4.42PAWDD193 pKa = 3.94PGEE196 pKa = 3.78IRR198 pKa = 11.84TYY200 pKa = 10.35TFF202 pKa = 3.32
Molecular weight: 21.9 kDa
Isoelectric point according different methods:
Protein with the highest isoelectric point:
>tr|A0A2D0W988|A0A2D0W988_9CAUD aGPT-Pplase2 domain-containing protein OS=Bordetella phage CN2 OX=1916124 PE=4 SV=1
MM1 pKa = 7.36SWWAWINIVAAVAGFLYY18 pKa = 10.04WLRR21 pKa = 11.84GANQGFCLHH30 pKa = 6.29RR31 pKa = 11.84WEE33 pKa = 4.69AGRR36 pKa = 11.84NRR38 pKa = 11.84FLTGALTCSKK48 pKa = 9.71CGRR51 pKa = 11.84IMYY54 pKa = 8.38PEE56 pKa = 4.19RR57 pKa = 11.84MRR59 pKa = 11.84FLRR62 pKa = 11.84LYY64 pKa = 9.68RR65 pKa = 11.84ALGRR69 pKa = 11.84IEE71 pKa = 4.34MEE73 pKa = 4.19NKK75 pKa = 9.06QQ76 pKa = 3.4
MM1 pKa = 7.36SWWAWINIVAAVAGFLYY18 pKa = 10.04WLRR21 pKa = 11.84GANQGFCLHH30 pKa = 6.29RR31 pKa = 11.84WEE33 pKa = 4.69AGRR36 pKa = 11.84NRR38 pKa = 11.84FLTGALTCSKK48 pKa = 9.71CGRR51 pKa = 11.84IMYY54 pKa = 8.38PEE56 pKa = 4.19RR57 pKa = 11.84MRR59 pKa = 11.84FLRR62 pKa = 11.84LYY64 pKa = 9.68RR65 pKa = 11.84ALGRR69 pKa = 11.84IEE71 pKa = 4.34MEE73 pKa = 4.19NKK75 pKa = 9.06QQ76 pKa = 3.4
Molecular weight: 9.04 kDa
Isoelectric point according different methods:
Peptides (in silico digests for buttom-up proteomics)
Below you can find in silico digests of the whole proteome with Trypsin, Chymotrypsin, Trypsin+LysC, LysN, ArgC proteases suitable for different mass spec machines.| Try ESI |
 |
|---|
| ChTry ESI |
 |
|---|
| ArgC ESI |
 |
|---|
| LysN ESI |
 |
|---|
| TryLysC ESI |
 |
|---|
| Try MALDI |
 |
|---|
| ChTry MALDI |
 |
|---|
| ArgC MALDI |
 |
|---|
| LysN MALDI |
 |
|---|
| TryLysC MALDI |
 |
|---|
| Try LTQ |
 |
|---|
| ChTry LTQ |
 |
|---|
| ArgC LTQ |
 |
|---|
| LysN LTQ |
 |
|---|
| TryLysC LTQ |
 |
|---|
| Try MSlow |
 |
|---|
| ChTry MSlow |
 |
|---|
| ArgC MSlow |
 |
|---|
| LysN MSlow |
 |
|---|
| TryLysC MSlow |
 |
|---|
| Try MShigh |
 |
|---|
| ChTry MShigh |
 |
|---|
| ArgC MShigh |
 |
|---|
| LysN MShigh |
 |
|---|
| TryLysC MShigh |
 |
|---|
General Statistics
Number of major isoforms |
Number of additional isoforms |
Number of all proteins |
Number of amino acids |
Min. Seq. Length |
Max. Seq. Length |
Avg. Seq. Length |
Avg. Mol. Weight |
|---|---|---|---|---|---|---|---|
0 |
19328 |
38 |
939 |
238.6 |
26.44 |
Amino acid frequency
Ala |
Cys |
Asp |
Glu |
Phe |
Gly |
His |
Ile |
Lys |
Leu |
|---|---|---|---|---|---|---|---|---|---|
10.756 ± 0.379 | 0.978 ± 0.087 |
6.1 ± 0.192 | 7.305 ± 0.242 |
3.658 ± 0.148 | 7.952 ± 0.235 |
1.764 ± 0.147 | 4.418 ± 0.15 |
4.258 ± 0.268 | 8.739 ± 0.261 |
Met |
Asn |
Gln |
Pro |
Arg |
Ser |
Thr |
Val |
Trp |
Tyr |
|---|---|---|---|---|---|---|---|---|---|
2.049 ± 0.116 | 3.554 ± 0.171 |
5.298 ± 0.249 | 3.999 ± 0.124 |
7.124 ± 0.256 | 4.682 ± 0.208 |
5.427 ± 0.258 | 7.057 ± 0.195 |
1.976 ± 0.137 | 2.794 ± 0.123 |
Most of the basic statistics you can see at this page can be downloaded from this CSV file
Proteome-pI is available under Creative Commons Attribution-NoDerivs license, for more details see here
| Reference: Kozlowski LP. Proteome-pI 2.0: Proteome Isoelectric Point Database Update. Nucleic Acids Res. 2021, doi: 10.1093/nar/gkab944 | Contact: Lukasz P. Kozlowski |
