Escherichia phage mEp460_ev081
Taxonomy: Viruses; Duplodnaviria; Heunggongvirae; Uroviricota; Caudoviricetes; Caudovirales; Siphoviridae; unclassified Siphoviridae
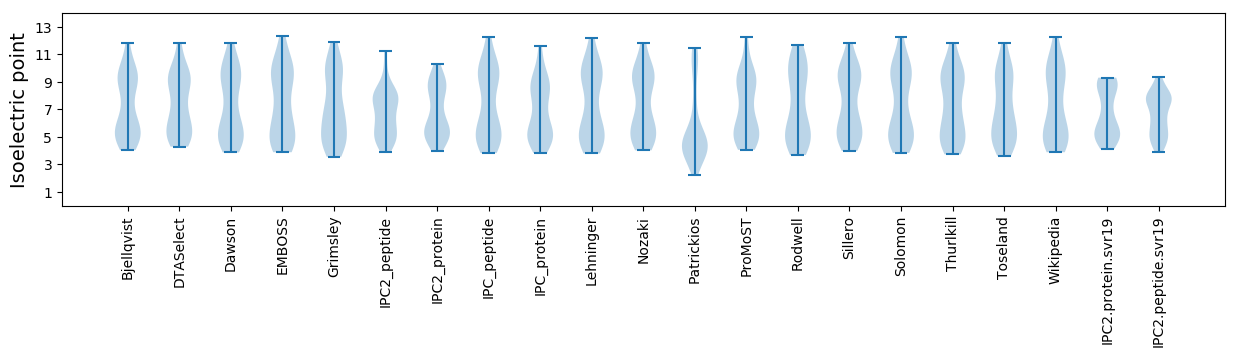
Average proteome isoelectric point is 6.76
Get precalculated fractions of proteins

Virtual 2D-PAGE plot for 60 proteins (isoelectric point calculated using IPC2_protein)
Get csv file with sequences according to given criteria:
* You can choose from 21 different methods for calculating isoelectric point
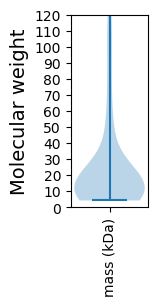
Summary statistics related to proteome-wise predictions

Protein with the lowest isoelectric point:
>tr|A0A653FW79|A0A653FW79_9CAUD GnsB protein OS=Escherichia phage mEp460_ev081 OX=2695846 PE=4 SV=1
MM1 pKa = 7.39PVEE4 pKa = 4.26ILSMDD9 pKa = 4.77FIASPPHH16 pKa = 5.29GTDD19 pKa = 4.45GIVIMCRR26 pKa = 11.84LPDD29 pKa = 3.44TSIRR33 pKa = 11.84ALIDD37 pKa = 3.28IYY39 pKa = 11.44AGDD42 pKa = 3.86DD43 pKa = 3.91AII45 pKa = 6.29
MM1 pKa = 7.39PVEE4 pKa = 4.26ILSMDD9 pKa = 4.77FIASPPHH16 pKa = 5.29GTDD19 pKa = 4.45GIVIMCRR26 pKa = 11.84LPDD29 pKa = 3.44TSIRR33 pKa = 11.84ALIDD37 pKa = 3.28IYY39 pKa = 11.44AGDD42 pKa = 3.86DD43 pKa = 3.91AII45 pKa = 6.29
Molecular weight: 4.84 kDa
Isoelectric point according different methods:
Protein with the highest isoelectric point:
>tr|A0A653FWX1|A0A653FWX1_9CAUD Uncharacterized protein OS=Escherichia phage mEp460_ev081 OX=2695846 PE=4 SV=1
MM1 pKa = 7.57TDD3 pKa = 4.1EE4 pKa = 4.16ISKK7 pKa = 9.61TSLFPRR13 pKa = 11.84RR14 pKa = 11.84SRR16 pKa = 11.84PVAGTPTGRR25 pKa = 11.84TRR27 pKa = 11.84QPDD30 pKa = 3.32NRR32 pKa = 11.84DD33 pKa = 2.98EE34 pKa = 4.2HH35 pKa = 6.89LKK37 pKa = 10.78QSVTT41 pKa = 3.52
MM1 pKa = 7.57TDD3 pKa = 4.1EE4 pKa = 4.16ISKK7 pKa = 9.61TSLFPRR13 pKa = 11.84RR14 pKa = 11.84SRR16 pKa = 11.84PVAGTPTGRR25 pKa = 11.84TRR27 pKa = 11.84QPDD30 pKa = 3.32NRR32 pKa = 11.84DD33 pKa = 2.98EE34 pKa = 4.2HH35 pKa = 6.89LKK37 pKa = 10.78QSVTT41 pKa = 3.52
Molecular weight: 4.67 kDa
Isoelectric point according different methods:
Peptides (in silico digests for buttom-up proteomics)
Below you can find in silico digests of the whole proteome with Trypsin, Chymotrypsin, Trypsin+LysC, LysN, ArgC proteases suitable for different mass spec machines.| Try ESI |
 |
|---|
| ChTry ESI |
|
|---|
| ArgC ESI |
|
|---|
| LysN ESI |
|
|---|
| TryLysC ESI |
|
|---|
| Try MALDI |
|
|---|
| ChTry MALDI |
|
|---|
| ArgC MALDI |
|
|---|
| LysN MALDI |
|
|---|
| TryLysC MALDI |
|
|---|
| Try LTQ |
|
|---|
| ChTry LTQ |
|
|---|
| ArgC LTQ |
|
|---|
| LysN LTQ |
|
|---|
| TryLysC LTQ |
|
|---|
| Try MSlow |
|
|---|
| ChTry MSlow |
|
|---|
| ArgC MSlow |
|
|---|
| LysN MSlow |
|
|---|
| TryLysC MSlow |
|
|---|
| Try MShigh |
|
|---|
| ChTry MShigh |
|
|---|
| ArgC MShigh |
|
|---|
| LysN MShigh |
|
|---|
| TryLysC MShigh |
|
|---|
General Statistics
Number of major isoforms |
Number of additional isoforms |
Number of all proteins |
Number of amino acids |
Min. Seq. Length |
Max. Seq. Length |
Avg. Seq. Length |
Avg. Mol. Weight |
|---|---|---|---|---|---|---|---|
0 |
12989 |
38 |
1137 |
216.5 |
23.98 |
Amino acid frequency
Ala |
Cys |
Asp |
Glu |
Phe |
Gly |
His |
Ile |
Lys |
Leu |
|---|---|---|---|---|---|---|---|---|---|
9.939 ± 0.855 | 1.163 ± 0.194 |
5.774 ± 0.272 | 6.506 ± 0.325 |
3.249 ± 0.245 | 7.083 ± 0.277 |
1.725 ± 0.195 | 5.258 ± 0.26 |
5.528 ± 0.247 | 7.375 ± 0.483 |
Met |
Asn |
Gln |
Pro |
Arg |
Ser |
Thr |
Val |
Trp |
Tyr |
|---|---|---|---|---|---|---|---|---|---|
2.595 ± 0.217 | 4.265 ± 0.251 |
4.065 ± 0.34 | 4.458 ± 0.47 |
6.313 ± 0.46 | 7.075 ± 0.567 |
6.459 ± 0.518 | 6.706 ± 0.429 |
1.694 ± 0.154 | 2.772 ± 0.155 |
Most of the basic statistics you can see at this page can be downloaded from this CSV file
See this proteome in:

Proteome-pI is available under Creative Commons Attribution-NoDerivs license, for more details see here
| Reference: Kozlowski LP. Proteome-pI 2.0: Proteome Isoelectric Point Database Update. Nucleic Acids Res. 2021, doi: 10.1093/nar/gkab944 | Contact: Lukasz P. Kozlowski |