Firmicutes bacterium CAG:95
Taxonomy: cellular organisms; Bacteria; Terrabacteria group; Firmicutes; environmental samples
Average proteome isoelectric point is 5.93
Get precalculated fractions of proteins

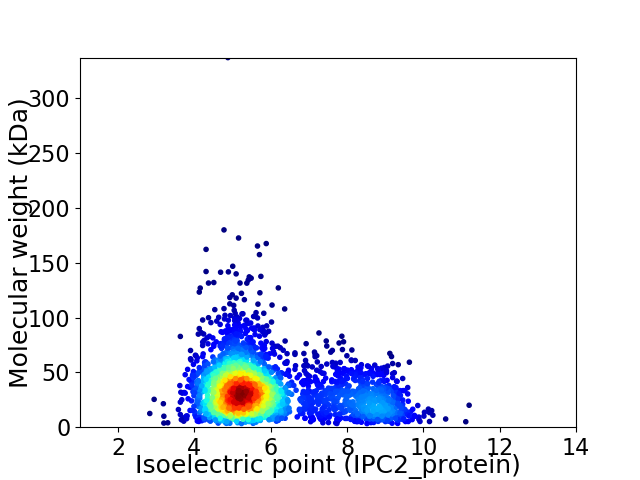
Virtual 2D-PAGE plot for 2767 proteins (isoelectric point calculated using IPC2_protein)
Get csv file with sequences according to given criteria:
* You can choose from 21 different methods for calculating isoelectric point
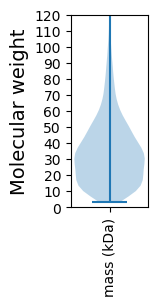
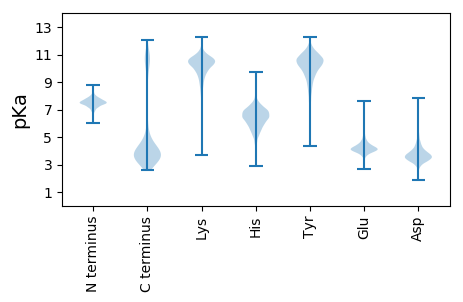
Summary statistics related to proteome-wise predictions


Protein with the lowest isoelectric point:
>tr|R7N703|R7N703_9FIRM Uncharacterized protein OS=Firmicutes bacterium CAG:95 OX=1262988 GN=BN816_00074 PE=4 SV=1
MM1 pKa = 7.88IFIHH5 pKa = 6.21NFHH8 pKa = 7.13KK9 pKa = 10.93FPGKK13 pKa = 10.17RR14 pKa = 11.84FLFPVLLLTLVLTGCGKK31 pKa = 10.46DD32 pKa = 3.21KK33 pKa = 11.11AVEE36 pKa = 3.97NYY38 pKa = 8.33RR39 pKa = 11.84ANMTQFFEE47 pKa = 4.65NIQTINDD54 pKa = 5.2AINQLDD60 pKa = 4.03PNDD63 pKa = 4.18EE64 pKa = 4.25NVGDD68 pKa = 3.92QLLPLLDD75 pKa = 4.4SLDD78 pKa = 3.72KK79 pKa = 11.25SFSQMASLEE88 pKa = 4.35VPDD91 pKa = 5.0GFPGVADD98 pKa = 4.54LAADD102 pKa = 3.52ASKK105 pKa = 11.48YY106 pKa = 5.61MTEE109 pKa = 4.2AVSCYY114 pKa = 8.26HH115 pKa = 5.32QAYY118 pKa = 10.38SGEE121 pKa = 4.53EE122 pKa = 3.96YY123 pKa = 10.67DD124 pKa = 4.53KK125 pKa = 11.19TSADD129 pKa = 2.89IAYY132 pKa = 10.41QNYY135 pKa = 8.62QFANKK140 pKa = 9.03RR141 pKa = 11.84LQYY144 pKa = 10.01IVQILHH150 pKa = 6.51GDD152 pKa = 3.14IPEE155 pKa = 4.56EE156 pKa = 3.71IFTYY160 pKa = 10.73DD161 pKa = 3.72EE162 pKa = 5.05DD163 pKa = 5.53DD164 pKa = 3.79STGSTDD170 pKa = 3.72SSADD174 pKa = 3.58DD175 pKa = 3.67FTEE178 pKa = 5.5DD179 pKa = 4.42DD180 pKa = 4.09TSTDD184 pKa = 3.62SADD187 pKa = 3.57DD188 pKa = 4.17AYY190 pKa = 10.5EE191 pKa = 4.28DD192 pKa = 4.48SEE194 pKa = 4.71DD195 pKa = 3.91SSEE198 pKa = 4.13EE199 pKa = 4.13DD200 pKa = 2.88EE201 pKa = 4.5FAYY204 pKa = 10.61GDD206 pKa = 3.66VPGTSTEE213 pKa = 4.27DD214 pKa = 3.11SAEE217 pKa = 4.14ASDD220 pKa = 4.2EE221 pKa = 4.3EE222 pKa = 4.73TVEE225 pKa = 4.02
MM1 pKa = 7.88IFIHH5 pKa = 6.21NFHH8 pKa = 7.13KK9 pKa = 10.93FPGKK13 pKa = 10.17RR14 pKa = 11.84FLFPVLLLTLVLTGCGKK31 pKa = 10.46DD32 pKa = 3.21KK33 pKa = 11.11AVEE36 pKa = 3.97NYY38 pKa = 8.33RR39 pKa = 11.84ANMTQFFEE47 pKa = 4.65NIQTINDD54 pKa = 5.2AINQLDD60 pKa = 4.03PNDD63 pKa = 4.18EE64 pKa = 4.25NVGDD68 pKa = 3.92QLLPLLDD75 pKa = 4.4SLDD78 pKa = 3.72KK79 pKa = 11.25SFSQMASLEE88 pKa = 4.35VPDD91 pKa = 5.0GFPGVADD98 pKa = 4.54LAADD102 pKa = 3.52ASKK105 pKa = 11.48YY106 pKa = 5.61MTEE109 pKa = 4.2AVSCYY114 pKa = 8.26HH115 pKa = 5.32QAYY118 pKa = 10.38SGEE121 pKa = 4.53EE122 pKa = 3.96YY123 pKa = 10.67DD124 pKa = 4.53KK125 pKa = 11.19TSADD129 pKa = 2.89IAYY132 pKa = 10.41QNYY135 pKa = 8.62QFANKK140 pKa = 9.03RR141 pKa = 11.84LQYY144 pKa = 10.01IVQILHH150 pKa = 6.51GDD152 pKa = 3.14IPEE155 pKa = 4.56EE156 pKa = 3.71IFTYY160 pKa = 10.73DD161 pKa = 3.72EE162 pKa = 5.05DD163 pKa = 5.53DD164 pKa = 3.79STGSTDD170 pKa = 3.72SSADD174 pKa = 3.58DD175 pKa = 3.67FTEE178 pKa = 5.5DD179 pKa = 4.42DD180 pKa = 4.09TSTDD184 pKa = 3.62SADD187 pKa = 3.57DD188 pKa = 4.17AYY190 pKa = 10.5EE191 pKa = 4.28DD192 pKa = 4.48SEE194 pKa = 4.71DD195 pKa = 3.91SSEE198 pKa = 4.13EE199 pKa = 4.13DD200 pKa = 2.88EE201 pKa = 4.5FAYY204 pKa = 10.61GDD206 pKa = 3.66VPGTSTEE213 pKa = 4.27DD214 pKa = 3.11SAEE217 pKa = 4.14ASDD220 pKa = 4.2EE221 pKa = 4.3EE222 pKa = 4.73TVEE225 pKa = 4.02
Molecular weight: 25.03 kDa
Isoelectric point according different methods:
Protein with the highest isoelectric point:
>tr|R7N6R7|R7N6R7_9FIRM Xylulose kinase OS=Firmicutes bacterium CAG:95 OX=1262988 GN=xylB PE=3 SV=1
MM1 pKa = 7.73EE2 pKa = 4.93MLQIATVTLIVTQIAIAILTVMVIQTATVIPTRR35 pKa = 11.84IRR37 pKa = 11.84IPTQTRR43 pKa = 11.84IRR45 pKa = 11.84IRR47 pKa = 11.84IPIRR51 pKa = 11.84IQIQTQTQIPTRR63 pKa = 11.84IQTQTQTQTRR73 pKa = 11.84IQILIWIPTQTQIPTPTRR91 pKa = 11.84ILIRR95 pKa = 11.84IQIQIQIQTRR105 pKa = 11.84IWILTLTRR113 pKa = 11.84ILIQTQIPTRR123 pKa = 11.84IQTQTPTRR131 pKa = 11.84ILIQIPTRR139 pKa = 11.84IRR141 pKa = 11.84IRR143 pKa = 11.84IQIQIRR149 pKa = 11.84IRR151 pKa = 11.84TQIQTATQTLRR162 pKa = 11.84QTTRR166 pKa = 11.84AMIPII171 pKa = 4.48
MM1 pKa = 7.73EE2 pKa = 4.93MLQIATVTLIVTQIAIAILTVMVIQTATVIPTRR35 pKa = 11.84IRR37 pKa = 11.84IPTQTRR43 pKa = 11.84IRR45 pKa = 11.84IRR47 pKa = 11.84IPIRR51 pKa = 11.84IQIQTQTQIPTRR63 pKa = 11.84IQTQTQTQTRR73 pKa = 11.84IQILIWIPTQTQIPTPTRR91 pKa = 11.84ILIRR95 pKa = 11.84IQIQIQIQTRR105 pKa = 11.84IWILTLTRR113 pKa = 11.84ILIQTQIPTRR123 pKa = 11.84IQTQTPTRR131 pKa = 11.84ILIQIPTRR139 pKa = 11.84IRR141 pKa = 11.84IRR143 pKa = 11.84IQIQIRR149 pKa = 11.84IRR151 pKa = 11.84TQIQTATQTLRR162 pKa = 11.84QTTRR166 pKa = 11.84AMIPII171 pKa = 4.48
Molecular weight: 20.03 kDa
Isoelectric point according different methods:
Peptides (in silico digests for buttom-up proteomics)
Below you can find in silico digests of the whole proteome with Trypsin, Chymotrypsin, Trypsin+LysC, LysN, ArgC proteases suitable for different mass spec machines.| Try ESI |
 |
|---|
| ChTry ESI |
 |
|---|
| ArgC ESI |
 |
|---|
| LysN ESI |
 |
|---|
| TryLysC ESI |
 |
|---|
| Try MALDI |
 |
|---|
| ChTry MALDI |
 |
|---|
| ArgC MALDI |
 |
|---|
| LysN MALDI |
 |
|---|
| TryLysC MALDI |
 |
|---|
| Try LTQ |
 |
|---|
| ChTry LTQ |
 |
|---|
| ArgC LTQ |
 |
|---|
| LysN LTQ |
 |
|---|
| TryLysC LTQ |
 |
|---|
| Try MSlow |
 |
|---|
| ChTry MSlow |
 |
|---|
| ArgC MSlow |
 |
|---|
| LysN MSlow |
 |
|---|
| TryLysC MSlow |
 |
|---|
| Try MShigh |
 |
|---|
| ChTry MShigh |
 |
|---|
| ArgC MShigh |
 |
|---|
| LysN MShigh |
 |
|---|
| TryLysC MShigh |
 |
|---|
General Statistics
Number of major isoforms |
Number of additional isoforms |
Number of all proteins |
Number of amino acids |
Min. Seq. Length |
Max. Seq. Length |
Avg. Seq. Length |
Avg. Mol. Weight |
|---|---|---|---|---|---|---|---|
0 |
879927 |
29 |
2994 |
318.0 |
35.82 |
Amino acid frequency
Ala |
Cys |
Asp |
Glu |
Phe |
Gly |
His |
Ile |
Lys |
Leu |
|---|---|---|---|---|---|---|---|---|---|
7.221 ± 0.05 | 1.516 ± 0.014 |
5.628 ± 0.04 | 7.864 ± 0.055 |
4.13 ± 0.035 | 6.933 ± 0.042 |
1.838 ± 0.021 | 7.353 ± 0.039 |
6.499 ± 0.038 | 9.099 ± 0.05 |
Met |
Asn |
Gln |
Pro |
Arg |
Ser |
Thr |
Val |
Trp |
Tyr |
|---|---|---|---|---|---|---|---|---|---|
3.21 ± 0.021 | 4.319 ± 0.033 |
3.288 ± 0.029 | 3.506 ± 0.028 |
4.447 ± 0.029 | 5.649 ± 0.034 |
5.333 ± 0.034 | 6.866 ± 0.035 |
0.952 ± 0.017 | 4.348 ± 0.031 |
Most of the basic statistics you can see at this page can be downloaded from this CSV file
Proteome-pI is available under Creative Commons Attribution-NoDerivs license, for more details see here
| Reference: Kozlowski LP. Proteome-pI 2.0: Proteome Isoelectric Point Database Update. Nucleic Acids Res. 2021, doi: 10.1093/nar/gkab944 | Contact: Lukasz P. Kozlowski |
