Carrot red leaf virus
Taxonomy: Viruses; Riboviria; Orthornavirae; Pisuviricota; Pisoniviricetes; Sobelivirales; Solemoviridae; Polerovirus
Average proteome isoelectric point is 7.75
Get precalculated fractions of proteins

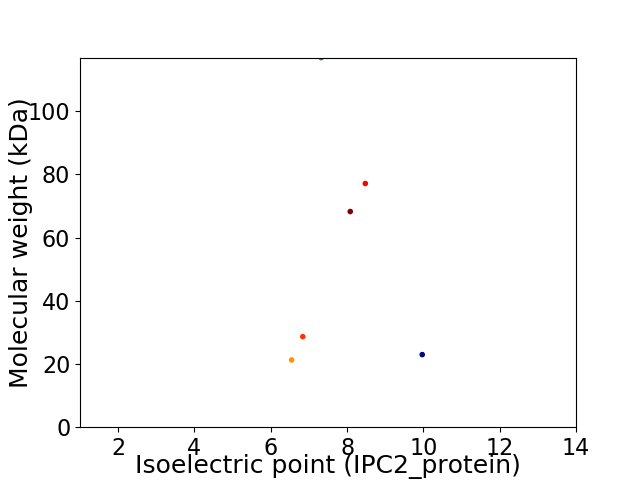
Virtual 2D-PAGE plot for 6 proteins (isoelectric point calculated using IPC2_protein)
Get csv file with sequences according to given criteria:
* You can choose from 21 different methods for calculating isoelectric point
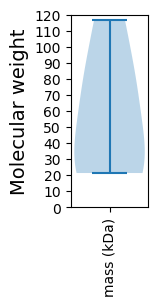
Summary statistics related to proteome-wise predictions


Protein with the lowest isoelectric point:
>tr|Q670I1|Q670I1_9LUTE Coat protein OS=Carrot red leaf virus OX=66200 GN=p3 PE=4 SV=1
MM1 pKa = 8.2DD2 pKa = 4.61SPRR5 pKa = 11.84EE6 pKa = 3.94QQEE9 pKa = 4.15LNPWLLSTHH18 pKa = 6.04LQGAHH23 pKa = 5.55VDD25 pKa = 3.61VHH27 pKa = 6.5GLSQSLWYY35 pKa = 9.91KK36 pKa = 9.9PHH38 pKa = 6.92EE39 pKa = 4.38LDD41 pKa = 5.25EE42 pKa = 6.43DD43 pKa = 4.35DD44 pKa = 5.78EE45 pKa = 4.71DD46 pKa = 6.2AEE48 pKa = 4.36DD49 pKa = 3.73AALVTHH55 pKa = 6.38EE56 pKa = 4.03QWEE59 pKa = 4.39DD60 pKa = 3.49PEE62 pKa = 5.51AEE64 pKa = 4.13SVARR68 pKa = 11.84SLCFRR73 pKa = 11.84RR74 pKa = 11.84TTSRR78 pKa = 11.84AAPVEE83 pKa = 4.27SSPSARR89 pKa = 11.84IYY91 pKa = 9.51QTTLLSAMDD100 pKa = 3.87YY101 pKa = 10.68SRR103 pKa = 11.84HH104 pKa = 4.48STNIKK109 pKa = 10.12SQTCEE114 pKa = 3.74YY115 pKa = 8.26VTSRR119 pKa = 11.84KK120 pKa = 8.6PHH122 pKa = 5.31QPPVARR128 pKa = 11.84SLMSWTPVVNSINFRR143 pKa = 11.84AQSTNSGSSRR153 pKa = 11.84MVKK156 pKa = 10.14PLGALKK162 pKa = 10.55RR163 pKa = 11.84LMGRR167 pKa = 11.84SGTPLRR173 pKa = 11.84RR174 pKa = 11.84TNSGSSGRR182 pKa = 11.84EE183 pKa = 3.34MEE185 pKa = 4.48VIRR188 pKa = 11.84RR189 pKa = 3.84
MM1 pKa = 8.2DD2 pKa = 4.61SPRR5 pKa = 11.84EE6 pKa = 3.94QQEE9 pKa = 4.15LNPWLLSTHH18 pKa = 6.04LQGAHH23 pKa = 5.55VDD25 pKa = 3.61VHH27 pKa = 6.5GLSQSLWYY35 pKa = 9.91KK36 pKa = 9.9PHH38 pKa = 6.92EE39 pKa = 4.38LDD41 pKa = 5.25EE42 pKa = 6.43DD43 pKa = 4.35DD44 pKa = 5.78EE45 pKa = 4.71DD46 pKa = 6.2AEE48 pKa = 4.36DD49 pKa = 3.73AALVTHH55 pKa = 6.38EE56 pKa = 4.03QWEE59 pKa = 4.39DD60 pKa = 3.49PEE62 pKa = 5.51AEE64 pKa = 4.13SVARR68 pKa = 11.84SLCFRR73 pKa = 11.84RR74 pKa = 11.84TTSRR78 pKa = 11.84AAPVEE83 pKa = 4.27SSPSARR89 pKa = 11.84IYY91 pKa = 9.51QTTLLSAMDD100 pKa = 3.87YY101 pKa = 10.68SRR103 pKa = 11.84HH104 pKa = 4.48STNIKK109 pKa = 10.12SQTCEE114 pKa = 3.74YY115 pKa = 8.26VTSRR119 pKa = 11.84KK120 pKa = 8.6PHH122 pKa = 5.31QPPVARR128 pKa = 11.84SLMSWTPVVNSINFRR143 pKa = 11.84AQSTNSGSSRR153 pKa = 11.84MVKK156 pKa = 10.14PLGALKK162 pKa = 10.55RR163 pKa = 11.84LMGRR167 pKa = 11.84SGTPLRR173 pKa = 11.84RR174 pKa = 11.84TNSGSSGRR182 pKa = 11.84EE183 pKa = 3.34MEE185 pKa = 4.48VIRR188 pKa = 11.84RR189 pKa = 3.84
Molecular weight: 21.27 kDa
Isoelectric point according different methods:
Protein with the highest isoelectric point:
>tr|Q670I2|Q670I2_9LUTE Readthrough protein OS=Carrot red leaf virus OX=66200 GN=p5 PE=3 SV=1
MM1 pKa = 7.21ATYY4 pKa = 10.96GLTKK8 pKa = 10.09RR9 pKa = 11.84ATGIKK14 pKa = 9.88PMVVVNTPSRR24 pKa = 11.84RR25 pKa = 11.84PRR27 pKa = 11.84RR28 pKa = 11.84RR29 pKa = 11.84TRR31 pKa = 11.84TKK33 pKa = 10.12PIVVVQTARR42 pKa = 11.84TGRR45 pKa = 11.84RR46 pKa = 11.84RR47 pKa = 11.84RR48 pKa = 11.84RR49 pKa = 11.84RR50 pKa = 11.84RR51 pKa = 11.84GRR53 pKa = 11.84GSGNPRR59 pKa = 11.84TMGGSGGGISSQKK72 pKa = 10.3FVFSKK77 pKa = 11.19DD78 pKa = 3.4NIAGSSGGVLTFGKK92 pKa = 10.25DD93 pKa = 3.58LSDD96 pKa = 4.34HH97 pKa = 6.6PAFSNGLLKK106 pKa = 10.69AFHH109 pKa = 6.29QYY111 pKa = 10.85KK112 pKa = 7.29ITNMRR117 pKa = 11.84VRR119 pKa = 11.84YY120 pKa = 9.57ISEE123 pKa = 4.23APSTAGGSISYY134 pKa = 9.94EE135 pKa = 3.8LDD137 pKa = 3.45PSCEE141 pKa = 3.99LDD143 pKa = 3.55KK144 pKa = 11.43LSSTIYY150 pKa = 10.67KK151 pKa = 10.45FGVLKK156 pKa = 10.76NGQASWSAEE165 pKa = 3.91KK166 pKa = 10.66INGKK170 pKa = 7.67EE171 pKa = 3.68WHH173 pKa = 6.89SSSEE177 pKa = 3.86NQFRR181 pKa = 11.84FLWKK185 pKa = 10.69GNGSNSTVGSFEE197 pKa = 3.46IHH199 pKa = 4.83YY200 pKa = 8.62TCLFQNPKK208 pKa = 10.32
MM1 pKa = 7.21ATYY4 pKa = 10.96GLTKK8 pKa = 10.09RR9 pKa = 11.84ATGIKK14 pKa = 9.88PMVVVNTPSRR24 pKa = 11.84RR25 pKa = 11.84PRR27 pKa = 11.84RR28 pKa = 11.84RR29 pKa = 11.84TRR31 pKa = 11.84TKK33 pKa = 10.12PIVVVQTARR42 pKa = 11.84TGRR45 pKa = 11.84RR46 pKa = 11.84RR47 pKa = 11.84RR48 pKa = 11.84RR49 pKa = 11.84RR50 pKa = 11.84RR51 pKa = 11.84GRR53 pKa = 11.84GSGNPRR59 pKa = 11.84TMGGSGGGISSQKK72 pKa = 10.3FVFSKK77 pKa = 11.19DD78 pKa = 3.4NIAGSSGGVLTFGKK92 pKa = 10.25DD93 pKa = 3.58LSDD96 pKa = 4.34HH97 pKa = 6.6PAFSNGLLKK106 pKa = 10.69AFHH109 pKa = 6.29QYY111 pKa = 10.85KK112 pKa = 7.29ITNMRR117 pKa = 11.84VRR119 pKa = 11.84YY120 pKa = 9.57ISEE123 pKa = 4.23APSTAGGSISYY134 pKa = 9.94EE135 pKa = 3.8LDD137 pKa = 3.45PSCEE141 pKa = 3.99LDD143 pKa = 3.55KK144 pKa = 11.43LSSTIYY150 pKa = 10.67KK151 pKa = 10.45FGVLKK156 pKa = 10.76NGQASWSAEE165 pKa = 3.91KK166 pKa = 10.66INGKK170 pKa = 7.67EE171 pKa = 3.68WHH173 pKa = 6.89SSSEE177 pKa = 3.86NQFRR181 pKa = 11.84FLWKK185 pKa = 10.69GNGSNSTVGSFEE197 pKa = 3.46IHH199 pKa = 4.83YY200 pKa = 8.62TCLFQNPKK208 pKa = 10.32
Molecular weight: 22.97 kDa
Isoelectric point according different methods:
Peptides (in silico digests for buttom-up proteomics)
Below you can find in silico digests of the whole proteome with Trypsin, Chymotrypsin, Trypsin+LysC, LysN, ArgC proteases suitable for different mass spec machines.| Try ESI |
 |
|---|
| ChTry ESI |
 |
|---|
| ArgC ESI |
 |
|---|
| LysN ESI |
 |
|---|
| TryLysC ESI |
 |
|---|
| Try MALDI |
 |
|---|
| ChTry MALDI |
 |
|---|
| ArgC MALDI |
 |
|---|
| LysN MALDI |
 |
|---|
| TryLysC MALDI |
 |
|---|
| Try LTQ |
 |
|---|
| ChTry LTQ |
 |
|---|
| ArgC LTQ |
 |
|---|
| LysN LTQ |
 |
|---|
| TryLysC LTQ |
 |
|---|
| Try MSlow |
 |
|---|
| ChTry MSlow |
 |
|---|
| ArgC MSlow |
 |
|---|
| LysN MSlow |
 |
|---|
| TryLysC MSlow |
 |
|---|
| Try MShigh |
 |
|---|
| ChTry MShigh |
 |
|---|
| ArgC MShigh |
 |
|---|
| LysN MShigh |
 |
|---|
| TryLysC MShigh |
 |
|---|
General Statistics
Number of major isoforms |
Number of additional isoforms |
Number of all proteins |
Number of amino acids |
Min. Seq. Length |
Max. Seq. Length |
Avg. Seq. Length |
Avg. Mol. Weight |
|---|---|---|---|---|---|---|---|
0 |
3011 |
189 |
1045 |
501.8 |
55.86 |
Amino acid frequency
Ala |
Cys |
Asp |
Glu |
Phe |
Gly |
His |
Ile |
Lys |
Leu |
|---|---|---|---|---|---|---|---|---|---|
5.978 ± 0.596 | 1.661 ± 0.376 |
4.351 ± 0.743 | 5.679 ± 0.472 |
4.052 ± 0.303 | 7.572 ± 0.68 |
2.325 ± 0.284 | 4.517 ± 0.296 |
5.812 ± 0.73 | 9.0 ± 0.964 |
Met |
Asn |
Gln |
Pro |
Arg |
Ser |
Thr |
Val |
Trp |
Tyr |
|---|---|---|---|---|---|---|---|---|---|
1.86 ± 0.212 | 4.915 ± 0.235 |
5.878 ± 0.652 | 3.753 ± 0.132 |
5.978 ± 0.808 | 9.698 ± 0.645 |
6.211 ± 0.434 | 5.878 ± 0.132 |
1.727 ± 0.212 | 3.122 ± 0.476 |
Most of the basic statistics you can see at this page can be downloaded from this CSV file
Proteome-pI is available under Creative Commons Attribution-NoDerivs license, for more details see here
| Reference: Kozlowski LP. Proteome-pI 2.0: Proteome Isoelectric Point Database Update. Nucleic Acids Res. 2021, doi: 10.1093/nar/gkab944 | Contact: Lukasz P. Kozlowski |
