Penicilliopsis zonata CBS 506.65
Taxonomy: cellular organisms; Eukaryota; Opisthokonta; Fungi; Dikarya; Ascomycota; saccharomyceta; Pezizomycotina; leotiomyceta; Eurotiomycetes; Eurotiomycetidae; Eurotiales; Aspergillaceae; Penicilliopsis; Penicilliopsis zonata
Average proteome isoelectric point is 6.39
Get precalculated fractions of proteins

Virtual 2D-PAGE plot for 9870 proteins (isoelectric point calculated using IPC2_protein)
Get csv file with sequences according to given criteria:
* You can choose from 21 different methods for calculating isoelectric point
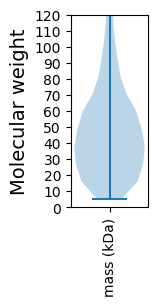
Summary statistics related to proteome-wise predictions


Protein with the lowest isoelectric point:
>tr|A0A1L9SG18|A0A1L9SG18_9EURO Uncharacterized protein OS=Penicilliopsis zonata CBS 506.65 OX=1073090 GN=ASPZODRAFT_2071155 PE=4 SV=1
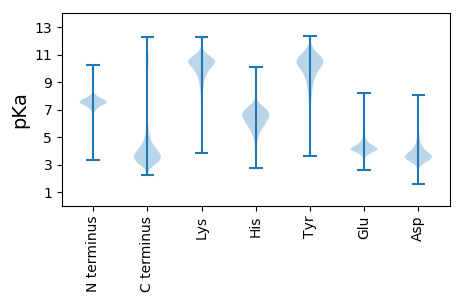
MM1 pKa = 7.76PSVQSTLIGLTLGAALAAAAPAPSRR26 pKa = 11.84VSEE29 pKa = 4.08LVKK32 pKa = 10.72KK33 pKa = 10.55SSCTFTEE40 pKa = 4.25AAQVSEE46 pKa = 4.7SKK48 pKa = 10.58SSCSTIVIDD57 pKa = 5.59SITVPAGEE65 pKa = 4.43TLDD68 pKa = 4.15LTDD71 pKa = 3.87LTEE74 pKa = 4.45GTTVTFKK81 pKa = 10.68GTTTWEE87 pKa = 4.04YY88 pKa = 11.12EE89 pKa = 4.15EE90 pKa = 4.36WDD92 pKa = 4.01GPLLEE97 pKa = 4.83ISGTKK102 pKa = 8.31ITVNQEE108 pKa = 3.0SDD110 pKa = 3.29AVLDD114 pKa = 4.27GNGAAWWDD122 pKa = 3.97GEE124 pKa = 4.16GSNGGKK130 pKa = 8.26TKK132 pKa = 10.59PKK134 pKa = 10.07FFYY137 pKa = 10.52AHH139 pKa = 6.64SLDD142 pKa = 4.11DD143 pKa = 3.93SVISGLYY150 pKa = 9.52IKK152 pKa = 8.11NTPVQCFSIEE162 pKa = 4.06SDD164 pKa = 3.12NLLIEE169 pKa = 5.15DD170 pKa = 3.95VTIDD174 pKa = 5.14DD175 pKa = 4.86SDD177 pKa = 5.08GDD179 pKa = 4.06TDD181 pKa = 5.23DD182 pKa = 5.75LGHH185 pKa = 6.06NTDD188 pKa = 4.0GFDD191 pKa = 3.38IGEE194 pKa = 4.25STYY197 pKa = 9.71ITITGATVYY206 pKa = 10.89NQDD209 pKa = 3.35DD210 pKa = 3.99CVAINSGEE218 pKa = 3.97NIYY221 pKa = 10.72FSGGTCSGGHH231 pKa = 5.98GLSIGSVGGRR241 pKa = 11.84SDD243 pKa = 3.45NTVKK247 pKa = 10.74NVTFIDD253 pKa = 3.81STVTDD258 pKa = 3.64SEE260 pKa = 4.23NGVRR264 pKa = 11.84IKK266 pKa = 9.73TVYY269 pKa = 10.39DD270 pKa = 3.23ATGTVEE276 pKa = 5.9DD277 pKa = 3.94ITYY280 pKa = 11.17SNIKK284 pKa = 10.28LSGISDD290 pKa = 3.74YY291 pKa = 11.71GLVIEE296 pKa = 4.83QDD298 pKa = 4.03YY299 pKa = 11.49EE300 pKa = 4.38NGDD303 pKa = 3.66PTGTPSNGVTISGVTLTEE321 pKa = 3.71ITGSVDD327 pKa = 3.16DD328 pKa = 5.1DD329 pKa = 3.75AVEE332 pKa = 4.32IYY334 pKa = 10.02ILCGDD339 pKa = 4.84GSCSDD344 pKa = 3.37WTVSDD349 pKa = 3.62VDD351 pKa = 3.34ITGGKK356 pKa = 8.21TSDD359 pKa = 3.09ACEE362 pKa = 4.09NVPSTISCTT371 pKa = 3.55
MM1 pKa = 7.76PSVQSTLIGLTLGAALAAAAPAPSRR26 pKa = 11.84VSEE29 pKa = 4.08LVKK32 pKa = 10.72KK33 pKa = 10.55SSCTFTEE40 pKa = 4.25AAQVSEE46 pKa = 4.7SKK48 pKa = 10.58SSCSTIVIDD57 pKa = 5.59SITVPAGEE65 pKa = 4.43TLDD68 pKa = 4.15LTDD71 pKa = 3.87LTEE74 pKa = 4.45GTTVTFKK81 pKa = 10.68GTTTWEE87 pKa = 4.04YY88 pKa = 11.12EE89 pKa = 4.15EE90 pKa = 4.36WDD92 pKa = 4.01GPLLEE97 pKa = 4.83ISGTKK102 pKa = 8.31ITVNQEE108 pKa = 3.0SDD110 pKa = 3.29AVLDD114 pKa = 4.27GNGAAWWDD122 pKa = 3.97GEE124 pKa = 4.16GSNGGKK130 pKa = 8.26TKK132 pKa = 10.59PKK134 pKa = 10.07FFYY137 pKa = 10.52AHH139 pKa = 6.64SLDD142 pKa = 4.11DD143 pKa = 3.93SVISGLYY150 pKa = 9.52IKK152 pKa = 8.11NTPVQCFSIEE162 pKa = 4.06SDD164 pKa = 3.12NLLIEE169 pKa = 5.15DD170 pKa = 3.95VTIDD174 pKa = 5.14DD175 pKa = 4.86SDD177 pKa = 5.08GDD179 pKa = 4.06TDD181 pKa = 5.23DD182 pKa = 5.75LGHH185 pKa = 6.06NTDD188 pKa = 4.0GFDD191 pKa = 3.38IGEE194 pKa = 4.25STYY197 pKa = 9.71ITITGATVYY206 pKa = 10.89NQDD209 pKa = 3.35DD210 pKa = 3.99CVAINSGEE218 pKa = 3.97NIYY221 pKa = 10.72FSGGTCSGGHH231 pKa = 5.98GLSIGSVGGRR241 pKa = 11.84SDD243 pKa = 3.45NTVKK247 pKa = 10.74NVTFIDD253 pKa = 3.81STVTDD258 pKa = 3.64SEE260 pKa = 4.23NGVRR264 pKa = 11.84IKK266 pKa = 9.73TVYY269 pKa = 10.39DD270 pKa = 3.23ATGTVEE276 pKa = 5.9DD277 pKa = 3.94ITYY280 pKa = 11.17SNIKK284 pKa = 10.28LSGISDD290 pKa = 3.74YY291 pKa = 11.71GLVIEE296 pKa = 4.83QDD298 pKa = 4.03YY299 pKa = 11.49EE300 pKa = 4.38NGDD303 pKa = 3.66PTGTPSNGVTISGVTLTEE321 pKa = 3.71ITGSVDD327 pKa = 3.16DD328 pKa = 5.1DD329 pKa = 3.75AVEE332 pKa = 4.32IYY334 pKa = 10.02ILCGDD339 pKa = 4.84GSCSDD344 pKa = 3.37WTVSDD349 pKa = 3.62VDD351 pKa = 3.34ITGGKK356 pKa = 8.21TSDD359 pKa = 3.09ACEE362 pKa = 4.09NVPSTISCTT371 pKa = 3.55
Molecular weight: 38.72 kDa
Isoelectric point according different methods:
Protein with the highest isoelectric point:
>tr|A0A1L9SPB4|A0A1L9SPB4_9EURO Uncharacterized protein OS=Penicilliopsis zonata CBS 506.65 OX=1073090 GN=ASPZODRAFT_13846 PE=3 SV=1
SS1 pKa = 6.85HH2 pKa = 7.5KK3 pKa = 10.71SFRR6 pKa = 11.84TKK8 pKa = 10.45QKK10 pKa = 9.84LAKK13 pKa = 9.55AQKK16 pKa = 8.59QNRR19 pKa = 11.84PIPQWIRR26 pKa = 11.84LRR28 pKa = 11.84TGNTIRR34 pKa = 11.84YY35 pKa = 5.79NAKK38 pKa = 8.89RR39 pKa = 11.84RR40 pKa = 11.84HH41 pKa = 4.14WRR43 pKa = 11.84KK44 pKa = 7.41TRR46 pKa = 11.84LGII49 pKa = 4.46
SS1 pKa = 6.85HH2 pKa = 7.5KK3 pKa = 10.71SFRR6 pKa = 11.84TKK8 pKa = 10.45QKK10 pKa = 9.84LAKK13 pKa = 9.55AQKK16 pKa = 8.59QNRR19 pKa = 11.84PIPQWIRR26 pKa = 11.84LRR28 pKa = 11.84TGNTIRR34 pKa = 11.84YY35 pKa = 5.79NAKK38 pKa = 8.89RR39 pKa = 11.84RR40 pKa = 11.84HH41 pKa = 4.14WRR43 pKa = 11.84KK44 pKa = 7.41TRR46 pKa = 11.84LGII49 pKa = 4.46
Molecular weight: 6.03 kDa
Isoelectric point according different methods:
Peptides (in silico digests for buttom-up proteomics)
Below you can find in silico digests of the whole proteome with Trypsin, Chymotrypsin, Trypsin+LysC, LysN, ArgC proteases suitable for different mass spec machines.| Try ESI |
 |
|---|
| ChTry ESI |
 |
|---|
| ArgC ESI |
 |
|---|
| LysN ESI |
 |
|---|
| TryLysC ESI |
 |
|---|
| Try MALDI |
 |
|---|
| ChTry MALDI |
 |
|---|
| ArgC MALDI |
 |
|---|
| LysN MALDI |
 |
|---|
| TryLysC MALDI |
 |
|---|
| Try LTQ |
 |
|---|
| ChTry LTQ |
 |
|---|
| ArgC LTQ |
 |
|---|
| LysN LTQ |
 |
|---|
| TryLysC LTQ |
 |
|---|
| Try MSlow |
 |
|---|
| ChTry MSlow |
 |
|---|
| ArgC MSlow |
 |
|---|
| LysN MSlow |
 |
|---|
| TryLysC MSlow |
 |
|---|
| Try MShigh |
 |
|---|
| ChTry MShigh |
 |
|---|
| ArgC MShigh |
 |
|---|
| LysN MShigh |
 |
|---|
| TryLysC MShigh |
 |
|---|
General Statistics
Number of major isoforms |
Number of additional isoforms |
Number of all proteins |
Number of amino acids |
Min. Seq. Length |
Max. Seq. Length |
Avg. Seq. Length |
Avg. Mol. Weight |
|---|---|---|---|---|---|---|---|
4774852 |
49 |
9981 |
483.8 |
53.52 |
Amino acid frequency
Ala |
Cys |
Asp |
Glu |
Phe |
Gly |
His |
Ile |
Lys |
Leu |
|---|---|---|---|---|---|---|---|---|---|
8.773 ± 0.028 | 1.268 ± 0.009 |
5.625 ± 0.018 | 6.184 ± 0.027 |
3.75 ± 0.016 | 6.716 ± 0.022 |
2.429 ± 0.011 | 4.825 ± 0.019 |
4.305 ± 0.025 | 9.339 ± 0.025 |
Met |
Asn |
Gln |
Pro |
Arg |
Ser |
Thr |
Val |
Trp |
Tyr |
|---|---|---|---|---|---|---|---|---|---|
2.136 ± 0.009 | 3.409 ± 0.014 |
5.972 ± 0.026 | 4.081 ± 0.017 |
6.259 ± 0.021 | 8.411 ± 0.029 |
6.016 ± 0.016 | 6.258 ± 0.018 |
1.462 ± 0.009 | 2.782 ± 0.013 |
Most of the basic statistics you can see at this page can be downloaded from this CSV file
Proteome-pI is available under Creative Commons Attribution-NoDerivs license, for more details see here
| Reference: Kozlowski LP. Proteome-pI 2.0: Proteome Isoelectric Point Database Update. Nucleic Acids Res. 2021, doi: 10.1093/nar/gkab944 | Contact: Lukasz P. Kozlowski |
