Flavonifractor sp. An100
Taxonomy: cellular organisms; Bacteria; Terrabacteria group; Firmicutes; Clostridia; Eubacteriales; Oscillospiraceae; Flavonifractor; unclassified Flavonifractor
Average proteome isoelectric point is 6.11
Get precalculated fractions of proteins

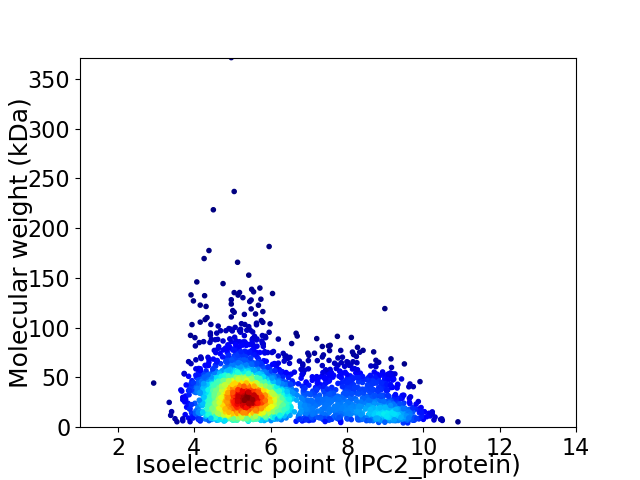
Virtual 2D-PAGE plot for 2837 proteins (isoelectric point calculated using IPC2_protein)
Get csv file with sequences according to given criteria:
* You can choose from 21 different methods for calculating isoelectric point
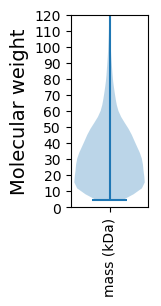
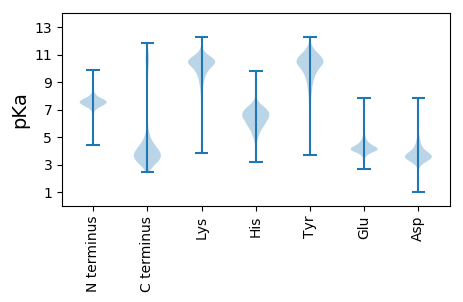
Summary statistics related to proteome-wise predictions


Protein with the lowest isoelectric point:
>tr|A0A1Y4WDK9|A0A1Y4WDK9_9FIRM Sodium/proline symporter OS=Flavonifractor sp. An100 OX=1965538 GN=B5E43_05940 PE=3 SV=1
MM1 pKa = 7.46KK2 pKa = 10.19KK3 pKa = 10.07YY4 pKa = 10.72LAMLLAGALSVSLLAGCGGDD24 pKa = 3.42SGSSASSTGSAGSAGSASSTGSDD47 pKa = 2.91SSAADD52 pKa = 3.23GTTFKK57 pKa = 11.16LGGTGPLTGGASIYY71 pKa = 10.99GLAAQRR77 pKa = 11.84GAQIAVDD84 pKa = 5.0EE85 pKa = 4.29IAEE88 pKa = 4.32AGGDD92 pKa = 3.35IQFTLRR98 pKa = 11.84YY99 pKa = 9.15EE100 pKa = 4.69DD101 pKa = 4.68DD102 pKa = 3.44VHH104 pKa = 7.95DD105 pKa = 4.74AEE107 pKa = 5.17KK108 pKa = 10.8AVNAYY113 pKa = 7.7NTLKK117 pKa = 10.12EE118 pKa = 3.69WGMQISLGSVTSKK131 pKa = 10.47PGEE134 pKa = 3.98ATSVLNYY141 pKa = 9.51EE142 pKa = 4.34DD143 pKa = 5.67RR144 pKa = 11.84IFALTPSASSPAVIEE159 pKa = 4.45SKK161 pKa = 11.32DD162 pKa = 3.66NVFQMCFSDD171 pKa = 4.13PNQGLASAQYY181 pKa = 10.3ISEE184 pKa = 4.2QNLGEE189 pKa = 4.14KK190 pKa = 10.54VFIIWKK196 pKa = 9.7NDD198 pKa = 3.04DD199 pKa = 3.72VYY201 pKa = 11.32STGIKK206 pKa = 10.23DD207 pKa = 3.59QFVTEE212 pKa = 4.57AEE214 pKa = 4.07ALNLNVVGDD223 pKa = 3.96ATFTTDD229 pKa = 2.55SQTDD233 pKa = 3.6FTVQLTQAQQAGADD247 pKa = 3.97LLFLPIYY254 pKa = 10.09YY255 pKa = 10.24DD256 pKa = 3.53AASLILSQANAMGYY270 pKa = 10.4DD271 pKa = 3.59PAIFGVDD278 pKa = 3.3GMDD281 pKa = 5.41GILTVDD287 pKa = 3.77GFDD290 pKa = 3.39PALAEE295 pKa = 4.09GVMLLTPFNADD306 pKa = 3.28AQDD309 pKa = 3.58EE310 pKa = 4.36ATQAFVQKK318 pKa = 10.36YY319 pKa = 4.86QAQYY323 pKa = 11.52GEE325 pKa = 4.48VPNQFAADD333 pKa = 4.02AYY335 pKa = 10.34DD336 pKa = 3.58CVYY339 pKa = 11.15ALKK342 pKa = 10.43QALEE346 pKa = 4.38TAGCTPDD353 pKa = 3.74MSAEE357 pKa = 4.47DD358 pKa = 3.53ICTKK362 pKa = 10.42LIEE365 pKa = 4.37VFPTITFEE373 pKa = 4.31GLTGDD378 pKa = 3.95GAGITWDD385 pKa = 3.34STGAVSKK392 pKa = 10.55SPKK395 pKa = 10.53GMVIQNGAYY404 pKa = 10.28VGMDD408 pKa = 3.03
MM1 pKa = 7.46KK2 pKa = 10.19KK3 pKa = 10.07YY4 pKa = 10.72LAMLLAGALSVSLLAGCGGDD24 pKa = 3.42SGSSASSTGSAGSAGSASSTGSDD47 pKa = 2.91SSAADD52 pKa = 3.23GTTFKK57 pKa = 11.16LGGTGPLTGGASIYY71 pKa = 10.99GLAAQRR77 pKa = 11.84GAQIAVDD84 pKa = 5.0EE85 pKa = 4.29IAEE88 pKa = 4.32AGGDD92 pKa = 3.35IQFTLRR98 pKa = 11.84YY99 pKa = 9.15EE100 pKa = 4.69DD101 pKa = 4.68DD102 pKa = 3.44VHH104 pKa = 7.95DD105 pKa = 4.74AEE107 pKa = 5.17KK108 pKa = 10.8AVNAYY113 pKa = 7.7NTLKK117 pKa = 10.12EE118 pKa = 3.69WGMQISLGSVTSKK131 pKa = 10.47PGEE134 pKa = 3.98ATSVLNYY141 pKa = 9.51EE142 pKa = 4.34DD143 pKa = 5.67RR144 pKa = 11.84IFALTPSASSPAVIEE159 pKa = 4.45SKK161 pKa = 11.32DD162 pKa = 3.66NVFQMCFSDD171 pKa = 4.13PNQGLASAQYY181 pKa = 10.3ISEE184 pKa = 4.2QNLGEE189 pKa = 4.14KK190 pKa = 10.54VFIIWKK196 pKa = 9.7NDD198 pKa = 3.04DD199 pKa = 3.72VYY201 pKa = 11.32STGIKK206 pKa = 10.23DD207 pKa = 3.59QFVTEE212 pKa = 4.57AEE214 pKa = 4.07ALNLNVVGDD223 pKa = 3.96ATFTTDD229 pKa = 2.55SQTDD233 pKa = 3.6FTVQLTQAQQAGADD247 pKa = 3.97LLFLPIYY254 pKa = 10.09YY255 pKa = 10.24DD256 pKa = 3.53AASLILSQANAMGYY270 pKa = 10.4DD271 pKa = 3.59PAIFGVDD278 pKa = 3.3GMDD281 pKa = 5.41GILTVDD287 pKa = 3.77GFDD290 pKa = 3.39PALAEE295 pKa = 4.09GVMLLTPFNADD306 pKa = 3.28AQDD309 pKa = 3.58EE310 pKa = 4.36ATQAFVQKK318 pKa = 10.36YY319 pKa = 4.86QAQYY323 pKa = 11.52GEE325 pKa = 4.48VPNQFAADD333 pKa = 4.02AYY335 pKa = 10.34DD336 pKa = 3.58CVYY339 pKa = 11.15ALKK342 pKa = 10.43QALEE346 pKa = 4.38TAGCTPDD353 pKa = 3.74MSAEE357 pKa = 4.47DD358 pKa = 3.53ICTKK362 pKa = 10.42LIEE365 pKa = 4.37VFPTITFEE373 pKa = 4.31GLTGDD378 pKa = 3.95GAGITWDD385 pKa = 3.34STGAVSKK392 pKa = 10.55SPKK395 pKa = 10.53GMVIQNGAYY404 pKa = 10.28VGMDD408 pKa = 3.03
Molecular weight: 42.46 kDa
Isoelectric point according different methods:
Protein with the highest isoelectric point:
>tr|A0A1Y4WAV0|A0A1Y4WAV0_9FIRM Acetolactate synthase OS=Flavonifractor sp. An100 OX=1965538 GN=B5E43_06015 PE=3 SV=1
MM1 pKa = 7.45LRR3 pKa = 11.84TYY5 pKa = 9.8QPKK8 pKa = 9.6KK9 pKa = 7.95RR10 pKa = 11.84QRR12 pKa = 11.84SKK14 pKa = 9.69EE15 pKa = 3.5HH16 pKa = 6.11GFRR19 pKa = 11.84KK20 pKa = 10.07RR21 pKa = 11.84MATRR25 pKa = 11.84NGRR28 pKa = 11.84KK29 pKa = 8.84VLARR33 pKa = 11.84RR34 pKa = 11.84RR35 pKa = 11.84AKK37 pKa = 10.04GRR39 pKa = 11.84ARR41 pKa = 11.84LTHH44 pKa = 6.28
MM1 pKa = 7.45LRR3 pKa = 11.84TYY5 pKa = 9.8QPKK8 pKa = 9.6KK9 pKa = 7.95RR10 pKa = 11.84QRR12 pKa = 11.84SKK14 pKa = 9.69EE15 pKa = 3.5HH16 pKa = 6.11GFRR19 pKa = 11.84KK20 pKa = 10.07RR21 pKa = 11.84MATRR25 pKa = 11.84NGRR28 pKa = 11.84KK29 pKa = 8.84VLARR33 pKa = 11.84RR34 pKa = 11.84RR35 pKa = 11.84AKK37 pKa = 10.04GRR39 pKa = 11.84ARR41 pKa = 11.84LTHH44 pKa = 6.28
Molecular weight: 5.39 kDa
Isoelectric point according different methods:
Peptides (in silico digests for buttom-up proteomics)
Below you can find in silico digests of the whole proteome with Trypsin, Chymotrypsin, Trypsin+LysC, LysN, ArgC proteases suitable for different mass spec machines.| Try ESI |
 |
|---|
| ChTry ESI |
 |
|---|
| ArgC ESI |
 |
|---|
| LysN ESI |
 |
|---|
| TryLysC ESI |
 |
|---|
| Try MALDI |
 |
|---|
| ChTry MALDI |
 |
|---|
| ArgC MALDI |
 |
|---|
| LysN MALDI |
 |
|---|
| TryLysC MALDI |
 |
|---|
| Try LTQ |
 |
|---|
| ChTry LTQ |
 |
|---|
| ArgC LTQ |
 |
|---|
| LysN LTQ |
 |
|---|
| TryLysC LTQ |
 |
|---|
| Try MSlow |
 |
|---|
| ChTry MSlow |
 |
|---|
| ArgC MSlow |
 |
|---|
| LysN MSlow |
 |
|---|
| TryLysC MSlow |
 |
|---|
| Try MShigh |
 |
|---|
| ChTry MShigh |
 |
|---|
| ArgC MShigh |
 |
|---|
| LysN MShigh |
 |
|---|
| TryLysC MShigh |
 |
|---|
General Statistics
Number of major isoforms |
Number of additional isoforms |
Number of all proteins |
Number of amino acids |
Min. Seq. Length |
Max. Seq. Length |
Avg. Seq. Length |
Avg. Mol. Weight |
|---|---|---|---|---|---|---|---|
0 |
881498 |
35 |
3337 |
310.7 |
34.38 |
Amino acid frequency
Ala |
Cys |
Asp |
Glu |
Phe |
Gly |
His |
Ile |
Lys |
Leu |
|---|---|---|---|---|---|---|---|---|---|
9.093 ± 0.057 | 1.596 ± 0.018 |
5.427 ± 0.036 | 6.84 ± 0.053 |
3.661 ± 0.034 | 7.951 ± 0.041 |
1.85 ± 0.024 | 5.503 ± 0.039 |
4.68 ± 0.047 | 10.244 ± 0.059 |
Met |
Asn |
Gln |
Pro |
Arg |
Ser |
Thr |
Val |
Trp |
Tyr |
|---|---|---|---|---|---|---|---|---|---|
2.745 ± 0.021 | 3.221 ± 0.025 |
4.356 ± 0.031 | 4.128 ± 0.03 |
5.653 ± 0.049 | 5.741 ± 0.037 |
5.553 ± 0.039 | 7.139 ± 0.04 |
1.159 ± 0.019 | 3.46 ± 0.032 |
Most of the basic statistics you can see at this page can be downloaded from this CSV file
Proteome-pI is available under Creative Commons Attribution-NoDerivs license, for more details see here
| Reference: Kozlowski LP. Proteome-pI 2.0: Proteome Isoelectric Point Database Update. Nucleic Acids Res. 2021, doi: 10.1093/nar/gkab944 | Contact: Lukasz P. Kozlowski |
