Shrimp hemocyte iridescent virus
Taxonomy: Viruses; Varidnaviria; Bamfordvirae; Nucleocytoviricota; Megaviricetes; Pimascovirales; Iridoviridae; Betairidovirinae; Decapodiridovirus; Decapod iridescent virus 1
Average proteome isoelectric point is 6.37
Get precalculated fractions of proteins

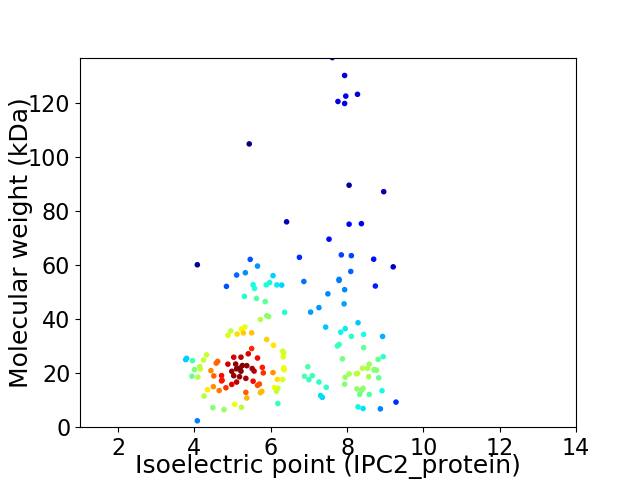
Virtual 2D-PAGE plot for 170 proteins (isoelectric point calculated using IPC2_protein)
Get csv file with sequences according to given criteria:
* You can choose from 21 different methods for calculating isoelectric point
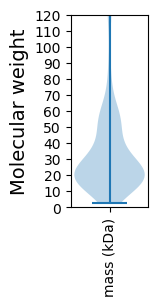
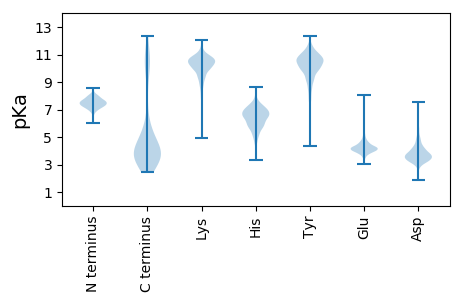
Summary statistics related to proteome-wise predictions


Protein with the lowest isoelectric point:
>tr|A0A291B0Y7|A0A291B0Y7_9VIRU Uncharacterized protein OS=Shrimp hemocyte iridescent virus OX=2039780 GN=147R PE=4 SV=1
MM1 pKa = 7.64FNNCVLKK8 pKa = 10.78AVFSDD13 pKa = 3.52DD14 pKa = 3.94TIEE17 pKa = 4.16KK18 pKa = 10.9LEE20 pKa = 4.18MLDD23 pKa = 2.86ITLPTKK29 pKa = 10.84LNFVGGEE36 pKa = 4.12YY37 pKa = 10.96YY38 pKa = 10.67CISRR42 pKa = 11.84NNIISSTAEE51 pKa = 3.87LQLTTSKK58 pKa = 10.18IQYY61 pKa = 8.99AKK63 pKa = 10.27IVIFSCMFGIGKK75 pKa = 9.19EE76 pKa = 4.21CVIEE80 pKa = 4.62DD81 pKa = 4.68DD82 pKa = 4.01GTVIPFNSQPTQVFQIDD99 pKa = 4.34DD100 pKa = 3.8IFQEE104 pKa = 4.74EE105 pKa = 4.73YY106 pKa = 10.6LLTMSRR112 pKa = 11.84SHH114 pKa = 6.61MDD116 pKa = 3.67SIVSDD121 pKa = 3.85YY122 pKa = 11.31QLLLDD127 pKa = 4.21YY128 pKa = 11.38LCDD131 pKa = 3.63NNMMDD136 pKa = 4.51EE137 pKa = 4.34FTKK140 pKa = 10.78SEE142 pKa = 5.16LIFKK146 pKa = 10.05LQTLANQCIDD156 pKa = 3.62FEE158 pKa = 4.54NPQEE162 pKa = 4.28PEE164 pKa = 3.58EE165 pKa = 4.98HH166 pKa = 6.69EE167 pKa = 4.2FQEE170 pKa = 5.01DD171 pKa = 3.08SGYY174 pKa = 11.11EE175 pKa = 4.01DD176 pKa = 3.73NSHH179 pKa = 6.22NEE181 pKa = 3.42WWW183 pKa = 3.44
MM1 pKa = 7.64FNNCVLKK8 pKa = 10.78AVFSDD13 pKa = 3.52DD14 pKa = 3.94TIEE17 pKa = 4.16KK18 pKa = 10.9LEE20 pKa = 4.18MLDD23 pKa = 2.86ITLPTKK29 pKa = 10.84LNFVGGEE36 pKa = 4.12YY37 pKa = 10.96YY38 pKa = 10.67CISRR42 pKa = 11.84NNIISSTAEE51 pKa = 3.87LQLTTSKK58 pKa = 10.18IQYY61 pKa = 8.99AKK63 pKa = 10.27IVIFSCMFGIGKK75 pKa = 9.19EE76 pKa = 4.21CVIEE80 pKa = 4.62DD81 pKa = 4.68DD82 pKa = 4.01GTVIPFNSQPTQVFQIDD99 pKa = 4.34DD100 pKa = 3.8IFQEE104 pKa = 4.74EE105 pKa = 4.73YY106 pKa = 10.6LLTMSRR112 pKa = 11.84SHH114 pKa = 6.61MDD116 pKa = 3.67SIVSDD121 pKa = 3.85YY122 pKa = 11.31QLLLDD127 pKa = 4.21YY128 pKa = 11.38LCDD131 pKa = 3.63NNMMDD136 pKa = 4.51EE137 pKa = 4.34FTKK140 pKa = 10.78SEE142 pKa = 5.16LIFKK146 pKa = 10.05LQTLANQCIDD156 pKa = 3.62FEE158 pKa = 4.54NPQEE162 pKa = 4.28PEE164 pKa = 3.58EE165 pKa = 4.98HH166 pKa = 6.69EE167 pKa = 4.2FQEE170 pKa = 5.01DD171 pKa = 3.08SGYY174 pKa = 11.11EE175 pKa = 4.01DD176 pKa = 3.73NSHH179 pKa = 6.22NEE181 pKa = 3.42WWW183 pKa = 3.44
Molecular weight: 21.27 kDa
Isoelectric point according different methods:
Protein with the highest isoelectric point:
>tr|A0A291B0N4|A0A291B0N4_9VIRU Uncharacterized protein OS=Shrimp hemocyte iridescent virus OX=2039780 GN=46R PE=4 SV=1
MM1 pKa = 7.81GPFLPTNEE9 pKa = 5.23IIPGMSPSRR18 pKa = 11.84VRR20 pKa = 11.84RR21 pKa = 11.84IQQKK25 pKa = 7.71YY26 pKa = 4.34TTPKK30 pKa = 10.35RR31 pKa = 11.84PSTYY35 pKa = 8.68YY36 pKa = 10.38DD37 pKa = 2.98ARR39 pKa = 11.84SRR41 pKa = 11.84PFKK44 pKa = 9.73PANDD48 pKa = 4.59IIPGMSAAEE57 pKa = 3.83VRR59 pKa = 11.84RR60 pKa = 11.84IKK62 pKa = 10.55KK63 pKa = 10.13KK64 pKa = 8.76YY65 pKa = 8.25AQPAEE70 pKa = 3.83EE71 pKa = 4.35SVYY74 pKa = 10.75FDD76 pKa = 5.62ALDD79 pKa = 3.92LDD81 pKa = 4.23
MM1 pKa = 7.81GPFLPTNEE9 pKa = 5.23IIPGMSPSRR18 pKa = 11.84VRR20 pKa = 11.84RR21 pKa = 11.84IQQKK25 pKa = 7.71YY26 pKa = 4.34TTPKK30 pKa = 10.35RR31 pKa = 11.84PSTYY35 pKa = 8.68YY36 pKa = 10.38DD37 pKa = 2.98ARR39 pKa = 11.84SRR41 pKa = 11.84PFKK44 pKa = 9.73PANDD48 pKa = 4.59IIPGMSAAEE57 pKa = 3.83VRR59 pKa = 11.84RR60 pKa = 11.84IKK62 pKa = 10.55KK63 pKa = 10.13KK64 pKa = 8.76YY65 pKa = 8.25AQPAEE70 pKa = 3.83EE71 pKa = 4.35SVYY74 pKa = 10.75FDD76 pKa = 5.62ALDD79 pKa = 3.92LDD81 pKa = 4.23
Molecular weight: 9.27 kDa
Isoelectric point according different methods:
Peptides (in silico digests for buttom-up proteomics)
Below you can find in silico digests of the whole proteome with Trypsin, Chymotrypsin, Trypsin+LysC, LysN, ArgC proteases suitable for different mass spec machines.| Try ESI |
 |
|---|
| ChTry ESI |
 |
|---|
| ArgC ESI |
 |
|---|
| LysN ESI |
 |
|---|
| TryLysC ESI |
 |
|---|
| Try MALDI |
 |
|---|
| ChTry MALDI |
 |
|---|
| ArgC MALDI |
 |
|---|
| LysN MALDI |
 |
|---|
| TryLysC MALDI |
 |
|---|
| Try LTQ |
 |
|---|
| ChTry LTQ |
 |
|---|
| ArgC LTQ |
 |
|---|
| LysN LTQ |
 |
|---|
| TryLysC LTQ |
 |
|---|
| Try MSlow |
 |
|---|
| ChTry MSlow |
 |
|---|
| ArgC MSlow |
 |
|---|
| LysN MSlow |
 |
|---|
| TryLysC MSlow |
 |
|---|
| Try MShigh |
 |
|---|
| ChTry MShigh |
 |
|---|
| ArgC MShigh |
 |
|---|
| LysN MShigh |
 |
|---|
| TryLysC MShigh |
 |
|---|
General Statistics
Number of major isoforms |
Number of additional isoforms |
Number of all proteins |
Number of amino acids |
Min. Seq. Length |
Max. Seq. Length |
Avg. Seq. Length |
Avg. Mol. Weight |
|---|---|---|---|---|---|---|---|
0 |
49110 |
21 |
1167 |
288.9 |
33.55 |
Amino acid frequency
Ala |
Cys |
Asp |
Glu |
Phe |
Gly |
His |
Ile |
Lys |
Leu |
|---|---|---|---|---|---|---|---|---|---|
3.612 ± 0.138 | 1.69 ± 0.092 |
6.241 ± 0.137 | 8.414 ± 0.204 |
5.343 ± 0.139 | 4.292 ± 0.145 |
1.765 ± 0.072 | 8.045 ± 0.126 |
9.636 ± 0.21 | 7.807 ± 0.142 |
Met |
Asn |
Gln |
Pro |
Arg |
Ser |
Thr |
Val |
Trp |
Tyr |
|---|---|---|---|---|---|---|---|---|---|
2.792 ± 0.087 | 6.728 ± 0.137 |
3.944 ± 0.171 | 3.437 ± 0.137 |
4.311 ± 0.175 | 6.373 ± 0.168 |
5.054 ± 0.201 | 5.661 ± 0.114 |
0.829 ± 0.05 | 4.026 ± 0.127 |
Most of the basic statistics you can see at this page can be downloaded from this CSV file
Proteome-pI is available under Creative Commons Attribution-NoDerivs license, for more details see here
| Reference: Kozlowski LP. Proteome-pI 2.0: Proteome Isoelectric Point Database Update. Nucleic Acids Res. 2021, doi: 10.1093/nar/gkab944 | Contact: Lukasz P. Kozlowski |
