Hydrogenophaga sp. IBVHS2
Taxonomy: cellular organisms; Bacteria; Proteobacteria; Betaproteobacteria; Burkholderiales; Comamonadaceae; Hydrogenophaga; unclassified Hydrogenophaga
Average proteome isoelectric point is 6.94
Get precalculated fractions of proteins

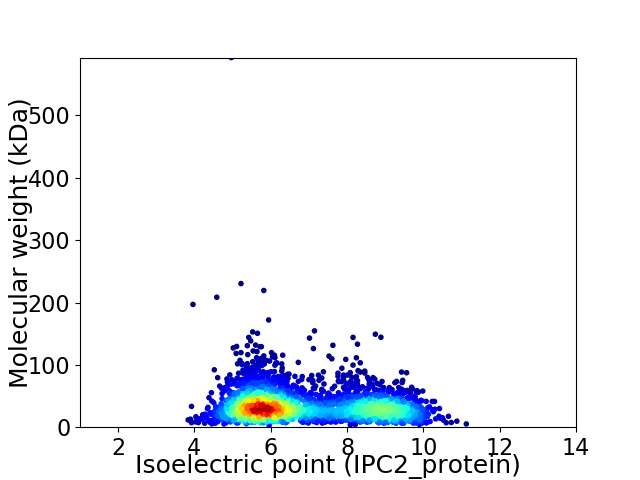
Virtual 2D-PAGE plot for 2952 proteins (isoelectric point calculated using IPC2_protein)
Get csv file with sequences according to given criteria:
* You can choose from 21 different methods for calculating isoelectric point
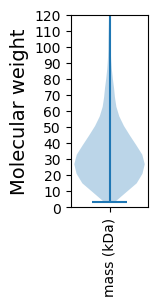
Summary statistics related to proteome-wise predictions


Protein with the lowest isoelectric point:
>tr|A0A1Y2Q8V0|A0A1Y2Q8V0_9BURK Cytochrome C assembly protein OS=Hydrogenophaga sp. IBVHS2 OX=1985170 GN=CAP38_09975 PE=4 SV=1
MM1 pKa = 8.07PEE3 pKa = 4.33TPPDD7 pKa = 3.63SPRR10 pKa = 11.84DD11 pKa = 3.76DD12 pKa = 3.75SHH14 pKa = 7.48PPASLPCVLVFNANDD29 pKa = 3.67PSGAGGLSADD39 pKa = 3.97LTAMSSASVHH49 pKa = 5.32VLSVVTGAYY58 pKa = 10.11VRR60 pKa = 11.84DD61 pKa = 3.53TSEE64 pKa = 3.99VHH66 pKa = 6.36DD67 pKa = 5.37HH68 pKa = 6.6IAFDD72 pKa = 3.81EE73 pKa = 4.36EE74 pKa = 4.6AVVDD78 pKa = 4.0QARR81 pKa = 11.84CALEE85 pKa = 4.41DD86 pKa = 3.59MPVQAFKK93 pKa = 11.21VGFVGTPEE101 pKa = 4.1NLSAIAGITSDD112 pKa = 3.78YY113 pKa = 10.64TDD115 pKa = 3.86VPVVAYY121 pKa = 9.63MPDD124 pKa = 3.82LSWWDD129 pKa = 3.38EE130 pKa = 4.05MAIDD134 pKa = 4.36TYY136 pKa = 11.61LDD138 pKa = 3.49AFTEE142 pKa = 4.16LLLPQTTVLVGNHH155 pKa = 5.01STLCRR160 pKa = 11.84WLLPEE165 pKa = 4.31WEE167 pKa = 4.55GDD169 pKa = 3.41RR170 pKa = 11.84PPNARR175 pKa = 11.84EE176 pKa = 3.61IARR179 pKa = 11.84AAAVHH184 pKa = 5.85GVPYY188 pKa = 10.28TLVTGFNAADD198 pKa = 3.34QHH200 pKa = 6.63LEE202 pKa = 3.83SHH204 pKa = 6.67LASPEE209 pKa = 4.08SVLASARR216 pKa = 11.84YY217 pKa = 9.12EE218 pKa = 3.88RR219 pKa = 11.84FEE221 pKa = 4.15ATFSGAGDD229 pKa = 3.74TLSAALCALIGGGADD244 pKa = 3.5LQSACAEE251 pKa = 3.93ALTYY255 pKa = 10.72LDD257 pKa = 3.41QCLDD261 pKa = 3.39AGFQPGMGHH270 pKa = 7.25AVPDD274 pKa = 3.71RR275 pKa = 11.84LFWAHH280 pKa = 6.67EE281 pKa = 4.17DD282 pKa = 4.25EE283 pKa = 5.55PDD285 pKa = 4.97DD286 pKa = 5.56DD287 pKa = 5.66AADD290 pKa = 4.07PQQDD294 pKa = 3.38AGTDD298 pKa = 3.6STLDD302 pKa = 3.64ADD304 pKa = 5.59DD305 pKa = 5.23FPLDD309 pKa = 3.9TTRR312 pKa = 11.84HH313 pKa = 4.6
MM1 pKa = 8.07PEE3 pKa = 4.33TPPDD7 pKa = 3.63SPRR10 pKa = 11.84DD11 pKa = 3.76DD12 pKa = 3.75SHH14 pKa = 7.48PPASLPCVLVFNANDD29 pKa = 3.67PSGAGGLSADD39 pKa = 3.97LTAMSSASVHH49 pKa = 5.32VLSVVTGAYY58 pKa = 10.11VRR60 pKa = 11.84DD61 pKa = 3.53TSEE64 pKa = 3.99VHH66 pKa = 6.36DD67 pKa = 5.37HH68 pKa = 6.6IAFDD72 pKa = 3.81EE73 pKa = 4.36EE74 pKa = 4.6AVVDD78 pKa = 4.0QARR81 pKa = 11.84CALEE85 pKa = 4.41DD86 pKa = 3.59MPVQAFKK93 pKa = 11.21VGFVGTPEE101 pKa = 4.1NLSAIAGITSDD112 pKa = 3.78YY113 pKa = 10.64TDD115 pKa = 3.86VPVVAYY121 pKa = 9.63MPDD124 pKa = 3.82LSWWDD129 pKa = 3.38EE130 pKa = 4.05MAIDD134 pKa = 4.36TYY136 pKa = 11.61LDD138 pKa = 3.49AFTEE142 pKa = 4.16LLLPQTTVLVGNHH155 pKa = 5.01STLCRR160 pKa = 11.84WLLPEE165 pKa = 4.31WEE167 pKa = 4.55GDD169 pKa = 3.41RR170 pKa = 11.84PPNARR175 pKa = 11.84EE176 pKa = 3.61IARR179 pKa = 11.84AAAVHH184 pKa = 5.85GVPYY188 pKa = 10.28TLVTGFNAADD198 pKa = 3.34QHH200 pKa = 6.63LEE202 pKa = 3.83SHH204 pKa = 6.67LASPEE209 pKa = 4.08SVLASARR216 pKa = 11.84YY217 pKa = 9.12EE218 pKa = 3.88RR219 pKa = 11.84FEE221 pKa = 4.15ATFSGAGDD229 pKa = 3.74TLSAALCALIGGGADD244 pKa = 3.5LQSACAEE251 pKa = 3.93ALTYY255 pKa = 10.72LDD257 pKa = 3.41QCLDD261 pKa = 3.39AGFQPGMGHH270 pKa = 7.25AVPDD274 pKa = 3.71RR275 pKa = 11.84LFWAHH280 pKa = 6.67EE281 pKa = 4.17DD282 pKa = 4.25EE283 pKa = 5.55PDD285 pKa = 4.97DD286 pKa = 5.56DD287 pKa = 5.66AADD290 pKa = 4.07PQQDD294 pKa = 3.38AGTDD298 pKa = 3.6STLDD302 pKa = 3.64ADD304 pKa = 5.59DD305 pKa = 5.23FPLDD309 pKa = 3.9TTRR312 pKa = 11.84HH313 pKa = 4.6
Molecular weight: 33.37 kDa
Isoelectric point according different methods:
Protein with the highest isoelectric point:
>tr|A0A1Y2Q4S1|A0A1Y2Q4S1_9BURK ABC transporter OS=Hydrogenophaga sp. IBVHS2 OX=1985170 GN=CAP38_13960 PE=3 SV=1
MM1 pKa = 7.35KK2 pKa = 9.43RR3 pKa = 11.84TYY5 pKa = 10.07QPSKK9 pKa = 9.07IRR11 pKa = 11.84RR12 pKa = 11.84ARR14 pKa = 11.84THH16 pKa = 5.91GFLVRR21 pKa = 11.84MKK23 pKa = 9.7TRR25 pKa = 11.84GGRR28 pKa = 11.84AVINARR34 pKa = 11.84RR35 pKa = 11.84AKK37 pKa = 9.41GRR39 pKa = 11.84KK40 pKa = 8.68RR41 pKa = 11.84LSVV44 pKa = 3.2
MM1 pKa = 7.35KK2 pKa = 9.43RR3 pKa = 11.84TYY5 pKa = 10.07QPSKK9 pKa = 9.07IRR11 pKa = 11.84RR12 pKa = 11.84ARR14 pKa = 11.84THH16 pKa = 5.91GFLVRR21 pKa = 11.84MKK23 pKa = 9.7TRR25 pKa = 11.84GGRR28 pKa = 11.84AVINARR34 pKa = 11.84RR35 pKa = 11.84AKK37 pKa = 9.41GRR39 pKa = 11.84KK40 pKa = 8.68RR41 pKa = 11.84LSVV44 pKa = 3.2
Molecular weight: 5.17 kDa
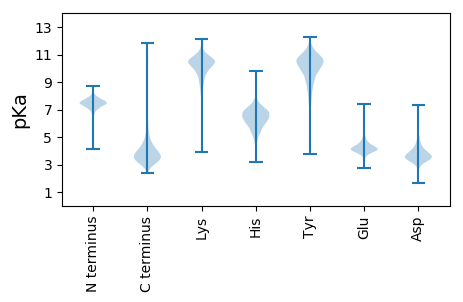
Isoelectric point according different methods:
Peptides (in silico digests for buttom-up proteomics)
Below you can find in silico digests of the whole proteome with Trypsin, Chymotrypsin, Trypsin+LysC, LysN, ArgC proteases suitable for different mass spec machines.| Try ESI |
 |
|---|
| ChTry ESI |
 |
|---|
| ArgC ESI |
 |
|---|
| LysN ESI |
 |
|---|
| TryLysC ESI |
 |
|---|
| Try MALDI |
 |
|---|
| ChTry MALDI |
 |
|---|
| ArgC MALDI |
 |
|---|
| LysN MALDI |
 |
|---|
| TryLysC MALDI |
 |
|---|
| Try LTQ |
 |
|---|
| ChTry LTQ |
 |
|---|
| ArgC LTQ |
 |
|---|
| LysN LTQ |
 |
|---|
| TryLysC LTQ |
 |
|---|
| Try MSlow |
 |
|---|
| ChTry MSlow |
 |
|---|
| ArgC MSlow |
 |
|---|
| LysN MSlow |
 |
|---|
| TryLysC MSlow |
 |
|---|
| Try MShigh |
 |
|---|
| ChTry MShigh |
 |
|---|
| ArgC MShigh |
 |
|---|
| LysN MShigh |
 |
|---|
| TryLysC MShigh |
 |
|---|
General Statistics
Number of major isoforms |
Number of additional isoforms |
Number of all proteins |
Number of amino acids |
Min. Seq. Length |
Max. Seq. Length |
Avg. Seq. Length |
Avg. Mol. Weight |
|---|---|---|---|---|---|---|---|
0 |
976957 |
24 |
5839 |
330.9 |
35.9 |
Amino acid frequency
Ala |
Cys |
Asp |
Glu |
Phe |
Gly |
His |
Ile |
Lys |
Leu |
|---|---|---|---|---|---|---|---|---|---|
12.856 ± 0.071 | 0.912 ± 0.015 |
5.396 ± 0.039 | 5.1 ± 0.04 |
3.32 ± 0.027 | 8.48 ± 0.046 |
2.368 ± 0.027 | 4.02 ± 0.031 |
2.72 ± 0.048 | 11.068 ± 0.065 |
Met |
Asn |
Gln |
Pro |
Arg |
Ser |
Thr |
Val |
Trp |
Tyr |
|---|---|---|---|---|---|---|---|---|---|
2.459 ± 0.022 | 2.344 ± 0.027 |
5.653 ± 0.038 | 4.262 ± 0.025 |
7.482 ± 0.047 | 5.011 ± 0.032 |
5.195 ± 0.033 | 7.865 ± 0.036 |
1.572 ± 0.022 | 1.917 ± 0.022 |
Most of the basic statistics you can see at this page can be downloaded from this CSV file
Proteome-pI is available under Creative Commons Attribution-NoDerivs license, for more details see here
| Reference: Kozlowski LP. Proteome-pI 2.0: Proteome Isoelectric Point Database Update. Nucleic Acids Res. 2021, doi: 10.1093/nar/gkab944 | Contact: Lukasz P. Kozlowski |
