Streptomyces mangrovisoli
Taxonomy: cellular organisms; Bacteria; Terrabacteria group; Actinobacteria; Actinomycetia; Streptomycetales; Streptomycetaceae; Streptomyces
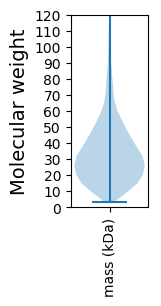
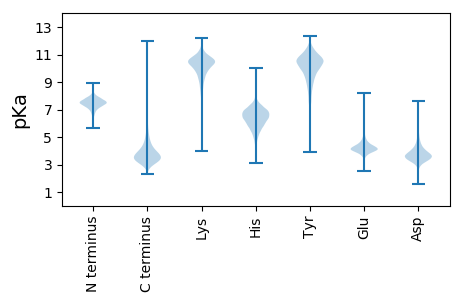
Average proteome isoelectric point is 6.38
Get precalculated fractions of proteins

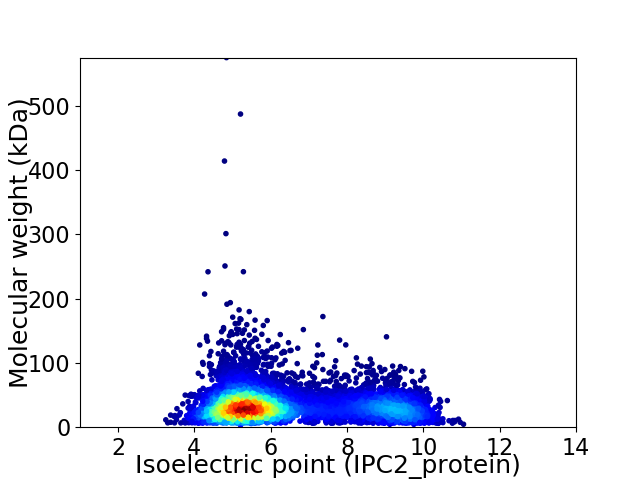
Virtual 2D-PAGE plot for 7461 proteins (isoelectric point calculated using IPC2_protein)
Get csv file with sequences according to given criteria:
* You can choose from 21 different methods for calculating isoelectric point
Summary statistics related to proteome-wise predictions


Protein with the lowest isoelectric point:
>tr|A0A1J4P6S9|A0A1J4P6S9_9ACTN Aminoglycoside phosphotransferase OS=Streptomyces mangrovisoli OX=1428628 GN=WN71_003825 PE=4 SV=1
MM1 pKa = 7.45SVPSARR7 pKa = 11.84PARR10 pKa = 11.84RR11 pKa = 11.84RR12 pKa = 11.84VSGAAPALALALVAAPAAVLAQAGPAGAAAATATATVQNGVAVYY56 pKa = 8.31TAAAGQTNKK65 pKa = 9.43VSATATDD72 pKa = 3.59LGGLQTIRR80 pKa = 11.84YY81 pKa = 8.77VIDD84 pKa = 3.33DD85 pKa = 4.42TVPITPGTGCTRR97 pKa = 11.84AGTDD101 pKa = 3.19ATQVVCDD108 pKa = 3.54VTTYY112 pKa = 11.26DD113 pKa = 3.86SQDD116 pKa = 3.13PYY118 pKa = 11.48ATLTVSLGDD127 pKa = 3.65RR128 pKa = 11.84NDD130 pKa = 3.4VVSYY134 pKa = 11.58ANTTGQDD141 pKa = 3.52YY142 pKa = 11.01YY143 pKa = 11.27FADD146 pKa = 4.05FDD148 pKa = 4.7LGSGNDD154 pKa = 3.54TFKK157 pKa = 10.91DD158 pKa = 3.36TGSVDD163 pKa = 3.08GNTVDD168 pKa = 3.71GGSGADD174 pKa = 3.64HH175 pKa = 6.35LTVGPVDD182 pKa = 3.59VALGGTGDD190 pKa = 3.85DD191 pKa = 3.94TIVAARR197 pKa = 11.84GTIAQGGAGRR207 pKa = 11.84DD208 pKa = 3.83TITLTGASAYY218 pKa = 10.54ADD220 pKa = 3.6GGADD224 pKa = 4.0ADD226 pKa = 4.5LLYY229 pKa = 11.1GGAGEE234 pKa = 4.23QSLSGGAGNDD244 pKa = 3.37TVRR247 pKa = 11.84AGTGNDD253 pKa = 2.63RR254 pKa = 11.84VYY256 pKa = 11.1GGTGNDD262 pKa = 3.02VLYY265 pKa = 10.96GNSGNDD271 pKa = 3.44TIYY274 pKa = 11.2GNSGNDD280 pKa = 3.09RR281 pKa = 11.84LYY283 pKa = 11.07GGPGTDD289 pKa = 3.65TLSGGPGSDD298 pKa = 4.59LVHH301 pKa = 6.67QSS303 pKa = 2.78
MM1 pKa = 7.45SVPSARR7 pKa = 11.84PARR10 pKa = 11.84RR11 pKa = 11.84RR12 pKa = 11.84VSGAAPALALALVAAPAAVLAQAGPAGAAAATATATVQNGVAVYY56 pKa = 8.31TAAAGQTNKK65 pKa = 9.43VSATATDD72 pKa = 3.59LGGLQTIRR80 pKa = 11.84YY81 pKa = 8.77VIDD84 pKa = 3.33DD85 pKa = 4.42TVPITPGTGCTRR97 pKa = 11.84AGTDD101 pKa = 3.19ATQVVCDD108 pKa = 3.54VTTYY112 pKa = 11.26DD113 pKa = 3.86SQDD116 pKa = 3.13PYY118 pKa = 11.48ATLTVSLGDD127 pKa = 3.65RR128 pKa = 11.84NDD130 pKa = 3.4VVSYY134 pKa = 11.58ANTTGQDD141 pKa = 3.52YY142 pKa = 11.01YY143 pKa = 11.27FADD146 pKa = 4.05FDD148 pKa = 4.7LGSGNDD154 pKa = 3.54TFKK157 pKa = 10.91DD158 pKa = 3.36TGSVDD163 pKa = 3.08GNTVDD168 pKa = 3.71GGSGADD174 pKa = 3.64HH175 pKa = 6.35LTVGPVDD182 pKa = 3.59VALGGTGDD190 pKa = 3.85DD191 pKa = 3.94TIVAARR197 pKa = 11.84GTIAQGGAGRR207 pKa = 11.84DD208 pKa = 3.83TITLTGASAYY218 pKa = 10.54ADD220 pKa = 3.6GGADD224 pKa = 4.0ADD226 pKa = 4.5LLYY229 pKa = 11.1GGAGEE234 pKa = 4.23QSLSGGAGNDD244 pKa = 3.37TVRR247 pKa = 11.84AGTGNDD253 pKa = 2.63RR254 pKa = 11.84VYY256 pKa = 11.1GGTGNDD262 pKa = 3.02VLYY265 pKa = 10.96GNSGNDD271 pKa = 3.44TIYY274 pKa = 11.2GNSGNDD280 pKa = 3.09RR281 pKa = 11.84LYY283 pKa = 11.07GGPGTDD289 pKa = 3.65TLSGGPGSDD298 pKa = 4.59LVHH301 pKa = 6.67QSS303 pKa = 2.78
Molecular weight: 29.69 kDa
Isoelectric point according different methods:
Protein with the highest isoelectric point:
>tr|A0A1J4P149|A0A1J4P149_9ACTN DNA ligase OS=Streptomyces mangrovisoli OX=1428628 GN=ligA PE=3 SV=1
MM1 pKa = 7.66KK2 pKa = 10.1VRR4 pKa = 11.84KK5 pKa = 9.01SLRR8 pKa = 11.84SLKK11 pKa = 10.27SKK13 pKa = 10.51PGAQVVRR20 pKa = 11.84RR21 pKa = 11.84RR22 pKa = 11.84GVTFVVNKK30 pKa = 9.85KK31 pKa = 9.57NPRR34 pKa = 11.84FKK36 pKa = 10.85ARR38 pKa = 11.84QGG40 pKa = 3.28
MM1 pKa = 7.66KK2 pKa = 10.1VRR4 pKa = 11.84KK5 pKa = 9.01SLRR8 pKa = 11.84SLKK11 pKa = 10.27SKK13 pKa = 10.51PGAQVVRR20 pKa = 11.84RR21 pKa = 11.84RR22 pKa = 11.84GVTFVVNKK30 pKa = 9.85KK31 pKa = 9.57NPRR34 pKa = 11.84FKK36 pKa = 10.85ARR38 pKa = 11.84QGG40 pKa = 3.28
Molecular weight: 4.61 kDa
Isoelectric point according different methods:
Peptides (in silico digests for buttom-up proteomics)
Below you can find in silico digests of the whole proteome with Trypsin, Chymotrypsin, Trypsin+LysC, LysN, ArgC proteases suitable for different mass spec machines.| Try ESI |
 |
|---|
| ChTry ESI |
 |
|---|
| ArgC ESI |
 |
|---|
| LysN ESI |
 |
|---|
| TryLysC ESI |
 |
|---|
| Try MALDI |
 |
|---|
| ChTry MALDI |
 |
|---|
| ArgC MALDI |
 |
|---|
| LysN MALDI |
 |
|---|
| TryLysC MALDI |
 |
|---|
| Try LTQ |
 |
|---|
| ChTry LTQ |
 |
|---|
| ArgC LTQ |
 |
|---|
| LysN LTQ |
 |
|---|
| TryLysC LTQ |
 |
|---|
| Try MSlow |
 |
|---|
| ChTry MSlow |
 |
|---|
| ArgC MSlow |
 |
|---|
| LysN MSlow |
 |
|---|
| TryLysC MSlow |
 |
|---|
| Try MShigh |
 |
|---|
| ChTry MShigh |
 |
|---|
| ArgC MShigh |
 |
|---|
| LysN MShigh |
 |
|---|
| TryLysC MShigh |
 |
|---|
General Statistics
Number of major isoforms |
Number of additional isoforms |
Number of all proteins |
Number of amino acids |
Min. Seq. Length |
Max. Seq. Length |
Avg. Seq. Length |
Avg. Mol. Weight |
|---|---|---|---|---|---|---|---|
0 |
2489176 |
29 |
5523 |
333.6 |
35.64 |
Amino acid frequency
Ala |
Cys |
Asp |
Glu |
Phe |
Gly |
His |
Ile |
Lys |
Leu |
|---|---|---|---|---|---|---|---|---|---|
13.943 ± 0.045 | 0.775 ± 0.007 |
6.11 ± 0.023 | 5.462 ± 0.027 |
2.722 ± 0.016 | 9.558 ± 0.027 |
2.365 ± 0.014 | 3.007 ± 0.021 |
2.052 ± 0.024 | 10.362 ± 0.032 |
Met |
Asn |
Gln |
Pro |
Arg |
Ser |
Thr |
Val |
Trp |
Tyr |
|---|---|---|---|---|---|---|---|---|---|
1.656 ± 0.011 | 1.703 ± 0.017 |
6.025 ± 0.027 | 2.714 ± 0.018 |
8.026 ± 0.038 | 5.063 ± 0.023 |
6.231 ± 0.029 | 8.57 ± 0.023 |
1.537 ± 0.011 | 2.118 ± 0.017 |
Most of the basic statistics you can see at this page can be downloaded from this CSV file
Proteome-pI is available under Creative Commons Attribution-NoDerivs license, for more details see here
| Reference: Kozlowski LP. Proteome-pI 2.0: Proteome Isoelectric Point Database Update. Nucleic Acids Res. 2021, doi: 10.1093/nar/gkab944 | Contact: Lukasz P. Kozlowski |
