Gordonia phage WhoseManz
Taxonomy: Viruses; Duplodnaviria; Heunggongvirae; Uroviricota; Caudoviricetes; Caudovirales; Siphoviridae; unclassified Siphoviridae
Average proteome isoelectric point is 6.09
Get precalculated fractions of proteins

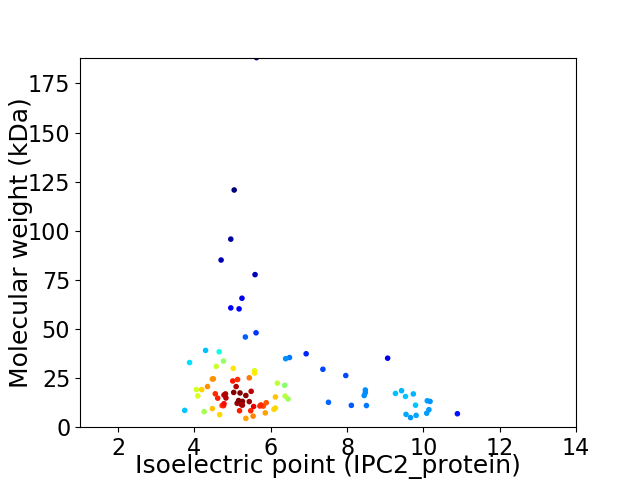
Virtual 2D-PAGE plot for 92 proteins (isoelectric point calculated using IPC2_protein)
Get csv file with sequences according to given criteria:
* You can choose from 21 different methods for calculating isoelectric point
Summary statistics related to proteome-wise predictions


Protein with the lowest isoelectric point:
>tr|A0A410TBG9|A0A410TBG9_9CAUD Tail assembly chaperone OS=Gordonia phage WhoseManz OX=2507855 GN=39 PE=4 SV=1
MM1 pKa = 7.5TWTQPEE7 pKa = 4.43LGDD10 pKa = 3.89LVAEE14 pKa = 4.24AAEE17 pKa = 4.9LYY19 pKa = 10.81DD20 pKa = 4.33GFNSDD25 pKa = 3.7FPEE28 pKa = 4.58GAVYY32 pKa = 10.23PDD34 pKa = 3.6IEE36 pKa = 4.31KK37 pKa = 11.02LLAKK41 pKa = 9.79VLRR44 pKa = 11.84PLVEE48 pKa = 4.36KK49 pKa = 10.49DD50 pKa = 3.11SHH52 pKa = 7.33IGNFVVSDD60 pKa = 3.83YY61 pKa = 11.31DD62 pKa = 3.32QDD64 pKa = 5.62SIDD67 pKa = 3.84EE68 pKa = 4.24DD69 pKa = 3.66TGEE72 pKa = 4.16EE73 pKa = 4.11VAGPFIEE80 pKa = 3.71IHH82 pKa = 5.85RR83 pKa = 11.84RR84 pKa = 11.84GGEE87 pKa = 3.81YY88 pKa = 10.75DD89 pKa = 3.86PDD91 pKa = 3.99DD92 pKa = 3.9FSYY95 pKa = 10.78YY96 pKa = 10.12PNVEE100 pKa = 3.78VLFWGKK106 pKa = 9.89SRR108 pKa = 11.84PVANDD113 pKa = 3.28TAHH116 pKa = 7.3KK117 pKa = 9.63GTILLLGCSGAVIDD131 pKa = 5.7GVQIDD136 pKa = 4.62LLEE139 pKa = 4.76DD140 pKa = 3.22ATGDD144 pKa = 3.66EE145 pKa = 4.84EE146 pKa = 4.93VRR148 pKa = 11.84QNNFDD153 pKa = 3.81DD154 pKa = 4.14RR155 pKa = 11.84CVTRR159 pKa = 11.84QFRR162 pKa = 11.84VGYY165 pKa = 9.99RR166 pKa = 11.84PTYY169 pKa = 10.09PDD171 pKa = 2.9
MM1 pKa = 7.5TWTQPEE7 pKa = 4.43LGDD10 pKa = 3.89LVAEE14 pKa = 4.24AAEE17 pKa = 4.9LYY19 pKa = 10.81DD20 pKa = 4.33GFNSDD25 pKa = 3.7FPEE28 pKa = 4.58GAVYY32 pKa = 10.23PDD34 pKa = 3.6IEE36 pKa = 4.31KK37 pKa = 11.02LLAKK41 pKa = 9.79VLRR44 pKa = 11.84PLVEE48 pKa = 4.36KK49 pKa = 10.49DD50 pKa = 3.11SHH52 pKa = 7.33IGNFVVSDD60 pKa = 3.83YY61 pKa = 11.31DD62 pKa = 3.32QDD64 pKa = 5.62SIDD67 pKa = 3.84EE68 pKa = 4.24DD69 pKa = 3.66TGEE72 pKa = 4.16EE73 pKa = 4.11VAGPFIEE80 pKa = 3.71IHH82 pKa = 5.85RR83 pKa = 11.84RR84 pKa = 11.84GGEE87 pKa = 3.81YY88 pKa = 10.75DD89 pKa = 3.86PDD91 pKa = 3.99DD92 pKa = 3.9FSYY95 pKa = 10.78YY96 pKa = 10.12PNVEE100 pKa = 3.78VLFWGKK106 pKa = 9.89SRR108 pKa = 11.84PVANDD113 pKa = 3.28TAHH116 pKa = 7.3KK117 pKa = 9.63GTILLLGCSGAVIDD131 pKa = 5.7GVQIDD136 pKa = 4.62LLEE139 pKa = 4.76DD140 pKa = 3.22ATGDD144 pKa = 3.66EE145 pKa = 4.84EE146 pKa = 4.93VRR148 pKa = 11.84QNNFDD153 pKa = 3.81DD154 pKa = 4.14RR155 pKa = 11.84CVTRR159 pKa = 11.84QFRR162 pKa = 11.84VGYY165 pKa = 9.99RR166 pKa = 11.84PTYY169 pKa = 10.09PDD171 pKa = 2.9
Molecular weight: 19.17 kDa
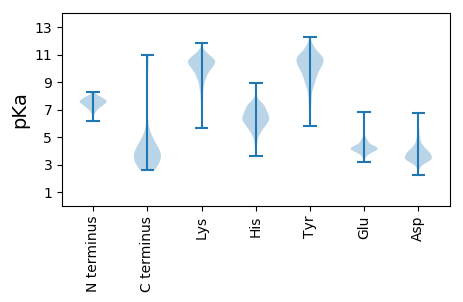
Isoelectric point according different methods:
Protein with the highest isoelectric point:
>tr|A0A410TBC2|A0A410TBC2_9CAUD Uncharacterized protein OS=Gordonia phage WhoseManz OX=2507855 GN=22 PE=4 SV=1
MM1 pKa = 6.97AQRR4 pKa = 11.84RR5 pKa = 11.84RR6 pKa = 11.84RR7 pKa = 11.84GGALNTRR14 pKa = 11.84KK15 pKa = 9.95KK16 pKa = 10.91GKK18 pKa = 10.05AKK20 pKa = 10.66NGAKK24 pKa = 9.07WGHH27 pKa = 5.7GFVPKK32 pKa = 10.29NAAARR37 pKa = 11.84KK38 pKa = 9.03LKK40 pKa = 10.66KK41 pKa = 10.41KK42 pKa = 10.3LDD44 pKa = 3.9RR45 pKa = 11.84NGKK48 pKa = 8.0RR49 pKa = 11.84RR50 pKa = 11.84KK51 pKa = 8.72RR52 pKa = 11.84TAQGYY57 pKa = 6.78PKK59 pKa = 10.41RR60 pKa = 4.1
MM1 pKa = 6.97AQRR4 pKa = 11.84RR5 pKa = 11.84RR6 pKa = 11.84RR7 pKa = 11.84GGALNTRR14 pKa = 11.84KK15 pKa = 9.95KK16 pKa = 10.91GKK18 pKa = 10.05AKK20 pKa = 10.66NGAKK24 pKa = 9.07WGHH27 pKa = 5.7GFVPKK32 pKa = 10.29NAAARR37 pKa = 11.84KK38 pKa = 9.03LKK40 pKa = 10.66KK41 pKa = 10.41KK42 pKa = 10.3LDD44 pKa = 3.9RR45 pKa = 11.84NGKK48 pKa = 8.0RR49 pKa = 11.84RR50 pKa = 11.84KK51 pKa = 8.72RR52 pKa = 11.84TAQGYY57 pKa = 6.78PKK59 pKa = 10.41RR60 pKa = 4.1
Molecular weight: 6.86 kDa
Isoelectric point according different methods:
Peptides (in silico digests for buttom-up proteomics)
Below you can find in silico digests of the whole proteome with Trypsin, Chymotrypsin, Trypsin+LysC, LysN, ArgC proteases suitable for different mass spec machines.| Try ESI |
 |
|---|
| ChTry ESI |
 |
|---|
| ArgC ESI |
 |
|---|
| LysN ESI |
 |
|---|
| TryLysC ESI |
 |
|---|
| Try MALDI |
 |
|---|
| ChTry MALDI |
 |
|---|
| ArgC MALDI |
 |
|---|
| LysN MALDI |
 |
|---|
| TryLysC MALDI |
 |
|---|
| Try LTQ |
 |
|---|
| ChTry LTQ |
 |
|---|
| ArgC LTQ |
 |
|---|
| LysN LTQ |
 |
|---|
| TryLysC LTQ |
 |
|---|
| Try MSlow |
 |
|---|
| ChTry MSlow |
 |
|---|
| ArgC MSlow |
 |
|---|
| LysN MSlow |
 |
|---|
| TryLysC MSlow |
 |
|---|
| Try MShigh |
 |
|---|
| ChTry MShigh |
 |
|---|
| ArgC MShigh |
 |
|---|
| LysN MShigh |
 |
|---|
| TryLysC MShigh |
 |
|---|
General Statistics
Number of major isoforms |
Number of additional isoforms |
Number of all proteins |
Number of amino acids |
Min. Seq. Length |
Max. Seq. Length |
Avg. Seq. Length |
Avg. Mol. Weight |
|---|---|---|---|---|---|---|---|
0 |
20452 |
39 |
1799 |
222.3 |
24.44 |
Amino acid frequency
Ala |
Cys |
Asp |
Glu |
Phe |
Gly |
His |
Ile |
Lys |
Leu |
|---|---|---|---|---|---|---|---|---|---|
10.415 ± 0.494 | 0.865 ± 0.117 |
7.232 ± 0.323 | 6.42 ± 0.276 |
3.056 ± 0.157 | 8.581 ± 0.378 |
2.005 ± 0.156 | 4.665 ± 0.211 |
4.161 ± 0.255 | 7.569 ± 0.267 |
Met |
Asn |
Gln |
Pro |
Arg |
Ser |
Thr |
Val |
Trp |
Tyr |
|---|---|---|---|---|---|---|---|---|---|
2.288 ± 0.119 | 3.296 ± 0.174 |
5.53 ± 0.198 | 3.203 ± 0.141 |
7.285 ± 0.38 | 5.427 ± 0.192 |
6.381 ± 0.219 | 7.144 ± 0.212 |
1.917 ± 0.127 | 2.562 ± 0.18 |
Most of the basic statistics you can see at this page can be downloaded from this CSV file
Proteome-pI is available under Creative Commons Attribution-NoDerivs license, for more details see here
| Reference: Kozlowski LP. Proteome-pI 2.0: Proteome Isoelectric Point Database Update. Nucleic Acids Res. 2021, doi: 10.1093/nar/gkab944 | Contact: Lukasz P. Kozlowski |
