Sulfolobus spindle-shaped virus 3
Taxonomy: Viruses; Fuselloviridae; Alphafusellovirus; unclassified Alphafusellovirus
Average proteome isoelectric point is 7.41
Get precalculated fractions of proteins

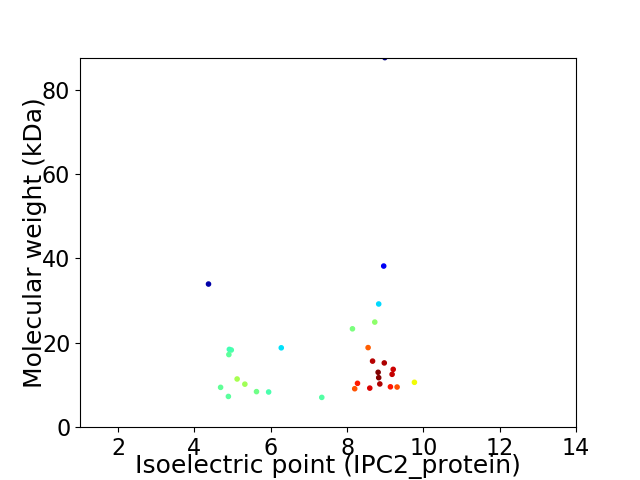
Virtual 2D-PAGE plot for 31 proteins (isoelectric point calculated using IPC2_protein)
Get csv file with sequences according to given criteria:
* You can choose from 21 different methods for calculating isoelectric point
Summary statistics related to proteome-wise predictions


Protein with the lowest isoelectric point:
>tr|A0A1S5WVN6|A0A1S5WVN6_9VIRU ORF19 OS=Sulfolobus spindle-shaped virus 3 OX=1959009 PE=4 SV=1
MM1 pKa = 7.6RR2 pKa = 11.84KK3 pKa = 9.01EE4 pKa = 3.92LLSLTFLALLLIPTLGILPSAQTSPNTWVIAFYY37 pKa = 10.29PGSYY41 pKa = 10.05PSGTSPSNFTSFTVNFTIPPFLQTSNGYY69 pKa = 10.32LGFVLTATVPATEE82 pKa = 4.55YY83 pKa = 10.54IGGLYY88 pKa = 10.35SGTVDD93 pKa = 2.85IALQIGLIFVTQTNTYY109 pKa = 10.34VLTAQVWTPYY119 pKa = 8.52GTQIYY124 pKa = 9.78GYY126 pKa = 10.33AEE128 pKa = 4.56TIYY131 pKa = 11.07LPANTEE137 pKa = 4.03AVISLIYY144 pKa = 10.53NYY146 pKa = 11.1ANGHH150 pKa = 4.51VAIGLLQGGVTVYY163 pKa = 10.82NVYY166 pKa = 10.35FPTLYY171 pKa = 10.51SHH173 pKa = 6.72NNCVYY178 pKa = 10.66NVTNNGGFSEE188 pKa = 4.6PSGQNPSFAIEE199 pKa = 4.03GTYY202 pKa = 9.77TGSPPFNDD210 pKa = 3.9TGWDD214 pKa = 3.81GMWFDD219 pKa = 4.96GAPISDD225 pKa = 3.49INAMTGYY232 pKa = 10.6SSATGVGGTASIPPYY247 pKa = 9.29YY248 pKa = 10.41AEE250 pKa = 4.34SGLTLFHH257 pKa = 6.8NVLFNYY263 pKa = 8.85WYY265 pKa = 10.82NPYY268 pKa = 10.61AWYY271 pKa = 9.73FSIGTPQDD279 pKa = 3.57YY280 pKa = 10.19SAHH283 pKa = 5.7GLHH286 pKa = 6.76YY287 pKa = 10.41IQLSEE292 pKa = 3.9GKK294 pKa = 9.74EE295 pKa = 3.86YY296 pKa = 9.94NTINGLNYY304 pKa = 9.99ALQWVPPP311 pKa = 4.15
MM1 pKa = 7.6RR2 pKa = 11.84KK3 pKa = 9.01EE4 pKa = 3.92LLSLTFLALLLIPTLGILPSAQTSPNTWVIAFYY37 pKa = 10.29PGSYY41 pKa = 10.05PSGTSPSNFTSFTVNFTIPPFLQTSNGYY69 pKa = 10.32LGFVLTATVPATEE82 pKa = 4.55YY83 pKa = 10.54IGGLYY88 pKa = 10.35SGTVDD93 pKa = 2.85IALQIGLIFVTQTNTYY109 pKa = 10.34VLTAQVWTPYY119 pKa = 8.52GTQIYY124 pKa = 9.78GYY126 pKa = 10.33AEE128 pKa = 4.56TIYY131 pKa = 11.07LPANTEE137 pKa = 4.03AVISLIYY144 pKa = 10.53NYY146 pKa = 11.1ANGHH150 pKa = 4.51VAIGLLQGGVTVYY163 pKa = 10.82NVYY166 pKa = 10.35FPTLYY171 pKa = 10.51SHH173 pKa = 6.72NNCVYY178 pKa = 10.66NVTNNGGFSEE188 pKa = 4.6PSGQNPSFAIEE199 pKa = 4.03GTYY202 pKa = 9.77TGSPPFNDD210 pKa = 3.9TGWDD214 pKa = 3.81GMWFDD219 pKa = 4.96GAPISDD225 pKa = 3.49INAMTGYY232 pKa = 10.6SSATGVGGTASIPPYY247 pKa = 9.29YY248 pKa = 10.41AEE250 pKa = 4.34SGLTLFHH257 pKa = 6.8NVLFNYY263 pKa = 8.85WYY265 pKa = 10.82NPYY268 pKa = 10.61AWYY271 pKa = 9.73FSIGTPQDD279 pKa = 3.57YY280 pKa = 10.19SAHH283 pKa = 5.7GLHH286 pKa = 6.76YY287 pKa = 10.41IQLSEE292 pKa = 3.9GKK294 pKa = 9.74EE295 pKa = 3.86YY296 pKa = 9.94NTINGLNYY304 pKa = 9.99ALQWVPPP311 pKa = 4.15
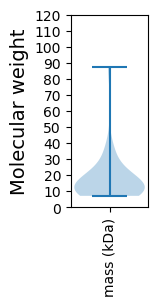
Molecular weight: 33.92 kDa
Isoelectric point according different methods:
Protein with the highest isoelectric point:
>tr|A0A1S5WVL6|A0A1S5WVL6_9VIRU ORF16 OS=Sulfolobus spindle-shaped virus 3 OX=1959009 PE=4 SV=1
MM1 pKa = 7.86AEE3 pKa = 3.81GRR5 pKa = 11.84EE6 pKa = 4.12DD7 pKa = 3.28MMRR10 pKa = 11.84WMTNGLVSPKK20 pKa = 10.23NIRR23 pKa = 11.84RR24 pKa = 11.84NNPRR28 pKa = 11.84FRR30 pKa = 11.84FNYY33 pKa = 9.47VDD35 pKa = 3.28YY36 pKa = 11.16CFAVQKK42 pKa = 10.95AKK44 pKa = 10.9AQTRR48 pKa = 11.84EE49 pKa = 4.09INTKK53 pKa = 9.97PEE55 pKa = 3.66IHH57 pKa = 6.49RR58 pKa = 11.84MVYY61 pKa = 9.59RR62 pKa = 11.84HH63 pKa = 5.68FVSSRR68 pKa = 11.84LNRR71 pKa = 11.84KK72 pKa = 7.66SLCFLCVFSRR82 pKa = 11.84LLHH85 pKa = 5.84GVGNN89 pKa = 4.27
MM1 pKa = 7.86AEE3 pKa = 3.81GRR5 pKa = 11.84EE6 pKa = 4.12DD7 pKa = 3.28MMRR10 pKa = 11.84WMTNGLVSPKK20 pKa = 10.23NIRR23 pKa = 11.84RR24 pKa = 11.84NNPRR28 pKa = 11.84FRR30 pKa = 11.84FNYY33 pKa = 9.47VDD35 pKa = 3.28YY36 pKa = 11.16CFAVQKK42 pKa = 10.95AKK44 pKa = 10.9AQTRR48 pKa = 11.84EE49 pKa = 4.09INTKK53 pKa = 9.97PEE55 pKa = 3.66IHH57 pKa = 6.49RR58 pKa = 11.84MVYY61 pKa = 9.59RR62 pKa = 11.84HH63 pKa = 5.68FVSSRR68 pKa = 11.84LNRR71 pKa = 11.84KK72 pKa = 7.66SLCFLCVFSRR82 pKa = 11.84LLHH85 pKa = 5.84GVGNN89 pKa = 4.27
Molecular weight: 10.64 kDa
Isoelectric point according different methods:
Peptides (in silico digests for buttom-up proteomics)
Below you can find in silico digests of the whole proteome with Trypsin, Chymotrypsin, Trypsin+LysC, LysN, ArgC proteases suitable for different mass spec machines.| Try ESI |
 |
|---|
| ChTry ESI |
 |
|---|
| ArgC ESI |
 |
|---|
| LysN ESI |
 |
|---|
| TryLysC ESI |
 |
|---|
| Try MALDI |
 |
|---|
| ChTry MALDI |
 |
|---|
| ArgC MALDI |
 |
|---|
| LysN MALDI |
 |
|---|
| TryLysC MALDI |
 |
|---|
| Try LTQ |
 |
|---|
| ChTry LTQ |
 |
|---|
| ArgC LTQ |
 |
|---|
| LysN LTQ |
 |
|---|
| TryLysC LTQ |
 |
|---|
| Try MSlow |
 |
|---|
| ChTry MSlow |
 |
|---|
| ArgC MSlow |
 |
|---|
| LysN MSlow |
 |
|---|
| TryLysC MSlow |
 |
|---|
| Try MShigh |
 |
|---|
| ChTry MShigh |
 |
|---|
| ArgC MShigh |
 |
|---|
| LysN MShigh |
 |
|---|
| TryLysC MShigh |
 |
|---|
General Statistics
Number of major isoforms |
Number of additional isoforms |
Number of all proteins |
Number of amino acids |
Min. Seq. Length |
Max. Seq. Length |
Avg. Seq. Length |
Avg. Mol. Weight |
|---|---|---|---|---|---|---|---|
0 |
4753 |
61 |
809 |
153.3 |
17.47 |
Amino acid frequency
Ala |
Cys |
Asp |
Glu |
Phe |
Gly |
His |
Ile |
Lys |
Leu |
|---|---|---|---|---|---|---|---|---|---|
4.797 ± 0.376 | 0.631 ± 0.194 |
3.303 ± 0.499 | 6.059 ± 1.212 |
4.608 ± 0.313 | 6.333 ± 0.622 |
1.094 ± 0.215 | 8.437 ± 0.484 |
7.364 ± 1.093 | 11.088 ± 0.659 |
Met |
Asn |
Gln |
Pro |
Arg |
Ser |
Thr |
Val |
Trp |
Tyr |
|---|---|---|---|---|---|---|---|---|---|
2.356 ± 0.277 | 5.512 ± 0.548 |
4.124 ± 0.47 | 3.072 ± 0.447 |
3.703 ± 0.798 | 6.733 ± 0.771 |
6.27 ± 0.78 | 7.238 ± 0.583 |
1.473 ± 0.231 | 5.807 ± 0.446 |
Most of the basic statistics you can see at this page can be downloaded from this CSV file
Proteome-pI is available under Creative Commons Attribution-NoDerivs license, for more details see here
| Reference: Kozlowski LP. Proteome-pI 2.0: Proteome Isoelectric Point Database Update. Nucleic Acids Res. 2021, doi: 10.1093/nar/gkab944 | Contact: Lukasz P. Kozlowski |
