Escherichia phage flopper
Taxonomy: Viruses; Duplodnaviria; Heunggongvirae; Uroviricota; Caudoviricetes; Caudovirales; Chaseviridae; Cleopatravirinae; Carltongylesvirus; Escherichia virus flopper
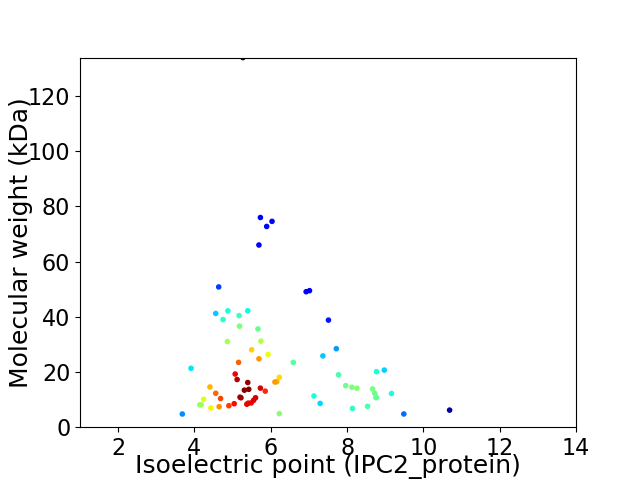
Average proteome isoelectric point is 6.11
Get precalculated fractions of proteins

Virtual 2D-PAGE plot for 72 proteins (isoelectric point calculated using IPC2_protein)
Get csv file with sequences according to given criteria:
* You can choose from 21 different methods for calculating isoelectric point
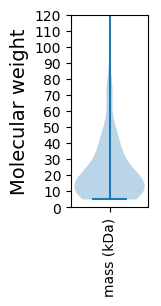
Summary statistics related to proteome-wise predictions


Protein with the lowest isoelectric point:
>tr|A0A6B9WWK7|A0A6B9WWK7_9CAUD Uncharacterized protein OS=Escherichia phage flopper OX=2696397 GN=flopper_12 PE=4 SV=1
MM1 pKa = 7.18QNDD4 pKa = 4.4NITQAVEE11 pKa = 3.82QLKK14 pKa = 9.83SWRR17 pKa = 11.84RR18 pKa = 11.84DD19 pKa = 2.9EE20 pKa = 4.16TLLVRR25 pKa = 11.84FYY27 pKa = 10.62TGEE30 pKa = 4.16TNSEE34 pKa = 4.54FVDD37 pKa = 3.51AWIDD41 pKa = 3.66GLSWRR46 pKa = 11.84HH47 pKa = 5.42YY48 pKa = 10.64DD49 pKa = 3.78FDD51 pKa = 3.65MRR53 pKa = 11.84DD54 pKa = 3.79YY55 pKa = 11.33LHH57 pKa = 7.07EE58 pKa = 4.74EE59 pKa = 3.94YY60 pKa = 10.72GIEE63 pKa = 4.07YY64 pKa = 9.81PEE66 pKa = 5.34DD67 pKa = 3.26GTYY70 pKa = 11.02DD71 pKa = 3.49VIEE74 pKa = 4.57SNEE77 pKa = 3.72EE78 pKa = 3.88DD79 pKa = 3.53VTEE82 pKa = 4.09VCFANGLFSIRR93 pKa = 11.84KK94 pKa = 7.3YY95 pKa = 11.46DD96 pKa = 3.41KK97 pKa = 10.92FNEE100 pKa = 4.17LLVDD104 pKa = 3.63TDD106 pKa = 4.55LDD108 pKa = 4.01VILAAFRR115 pKa = 11.84SGDD118 pKa = 3.06IDD120 pKa = 3.72IFTVDD125 pKa = 4.29DD126 pKa = 4.76LNDD129 pKa = 3.63KK130 pKa = 10.81VIARR134 pKa = 11.84CDD136 pKa = 3.57SIADD140 pKa = 3.5YY141 pKa = 10.45FRR143 pKa = 11.84QYY145 pKa = 11.6DD146 pKa = 4.18GIEE149 pKa = 4.37VPDD152 pKa = 4.04HH153 pKa = 5.92LRR155 pKa = 11.84PYY157 pKa = 10.2IDD159 pKa = 3.26WDD161 pKa = 3.56AVARR165 pKa = 11.84DD166 pKa = 3.78YY167 pKa = 11.83GSDD170 pKa = 3.43YY171 pKa = 10.74TFSEE175 pKa = 5.41GILFSNAA182 pKa = 2.85
MM1 pKa = 7.18QNDD4 pKa = 4.4NITQAVEE11 pKa = 3.82QLKK14 pKa = 9.83SWRR17 pKa = 11.84RR18 pKa = 11.84DD19 pKa = 2.9EE20 pKa = 4.16TLLVRR25 pKa = 11.84FYY27 pKa = 10.62TGEE30 pKa = 4.16TNSEE34 pKa = 4.54FVDD37 pKa = 3.51AWIDD41 pKa = 3.66GLSWRR46 pKa = 11.84HH47 pKa = 5.42YY48 pKa = 10.64DD49 pKa = 3.78FDD51 pKa = 3.65MRR53 pKa = 11.84DD54 pKa = 3.79YY55 pKa = 11.33LHH57 pKa = 7.07EE58 pKa = 4.74EE59 pKa = 3.94YY60 pKa = 10.72GIEE63 pKa = 4.07YY64 pKa = 9.81PEE66 pKa = 5.34DD67 pKa = 3.26GTYY70 pKa = 11.02DD71 pKa = 3.49VIEE74 pKa = 4.57SNEE77 pKa = 3.72EE78 pKa = 3.88DD79 pKa = 3.53VTEE82 pKa = 4.09VCFANGLFSIRR93 pKa = 11.84KK94 pKa = 7.3YY95 pKa = 11.46DD96 pKa = 3.41KK97 pKa = 10.92FNEE100 pKa = 4.17LLVDD104 pKa = 3.63TDD106 pKa = 4.55LDD108 pKa = 4.01VILAAFRR115 pKa = 11.84SGDD118 pKa = 3.06IDD120 pKa = 3.72IFTVDD125 pKa = 4.29DD126 pKa = 4.76LNDD129 pKa = 3.63KK130 pKa = 10.81VIARR134 pKa = 11.84CDD136 pKa = 3.57SIADD140 pKa = 3.5YY141 pKa = 10.45FRR143 pKa = 11.84QYY145 pKa = 11.6DD146 pKa = 4.18GIEE149 pKa = 4.37VPDD152 pKa = 4.04HH153 pKa = 5.92LRR155 pKa = 11.84PYY157 pKa = 10.2IDD159 pKa = 3.26WDD161 pKa = 3.56AVARR165 pKa = 11.84DD166 pKa = 3.78YY167 pKa = 11.83GSDD170 pKa = 3.43YY171 pKa = 10.74TFSEE175 pKa = 5.41GILFSNAA182 pKa = 2.85
Molecular weight: 21.35 kDa
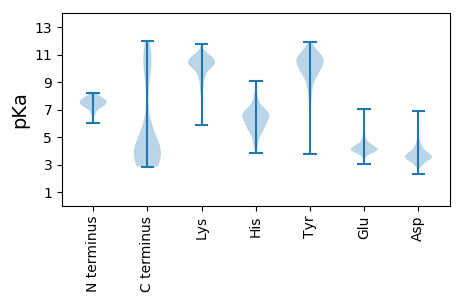
Isoelectric point according different methods:
Protein with the highest isoelectric point:
>tr|A0A6B9WSV8|A0A6B9WSV8_9CAUD Baseplate assembly protein OS=Escherichia phage flopper OX=2696397 GN=flopper_35 PE=4 SV=1
MM1 pKa = 7.68RR2 pKa = 11.84KK3 pKa = 9.56VKK5 pKa = 9.57TKK7 pKa = 9.42WYY9 pKa = 9.24MVGQLYY15 pKa = 10.79LDD17 pKa = 3.86RR18 pKa = 11.84NSFMVGQLYY27 pKa = 10.23LAEE30 pKa = 4.48ICSNRR35 pKa = 11.84SPTMKK40 pKa = 10.55
MM1 pKa = 7.68RR2 pKa = 11.84KK3 pKa = 9.56VKK5 pKa = 9.57TKK7 pKa = 9.42WYY9 pKa = 9.24MVGQLYY15 pKa = 10.79LDD17 pKa = 3.86RR18 pKa = 11.84NSFMVGQLYY27 pKa = 10.23LAEE30 pKa = 4.48ICSNRR35 pKa = 11.84SPTMKK40 pKa = 10.55
Molecular weight: 4.79 kDa
Isoelectric point according different methods:
Peptides (in silico digests for buttom-up proteomics)
Below you can find in silico digests of the whole proteome with Trypsin, Chymotrypsin, Trypsin+LysC, LysN, ArgC proteases suitable for different mass spec machines.| Try ESI |
 |
|---|
| ChTry ESI |
 |
|---|
| ArgC ESI |
 |
|---|
| LysN ESI |
 |
|---|
| TryLysC ESI |
 |
|---|
| Try MALDI |
 |
|---|
| ChTry MALDI |
 |
|---|
| ArgC MALDI |
 |
|---|
| LysN MALDI |
 |
|---|
| TryLysC MALDI |
 |
|---|
| Try LTQ |
 |
|---|
| ChTry LTQ |
 |
|---|
| ArgC LTQ |
 |
|---|
| LysN LTQ |
 |
|---|
| TryLysC LTQ |
 |
|---|
| Try MSlow |
 |
|---|
| ChTry MSlow |
 |
|---|
| ArgC MSlow |
 |
|---|
| LysN MSlow |
 |
|---|
| TryLysC MSlow |
 |
|---|
| Try MShigh |
 |
|---|
| ChTry MShigh |
 |
|---|
| ArgC MShigh |
 |
|---|
| LysN MShigh |
 |
|---|
| TryLysC MShigh |
 |
|---|
General Statistics
Number of major isoforms |
Number of additional isoforms |
Number of all proteins |
Number of amino acids |
Min. Seq. Length |
Max. Seq. Length |
Avg. Seq. Length |
Avg. Mol. Weight |
|---|---|---|---|---|---|---|---|
0 |
15211 |
40 |
1238 |
211.3 |
23.49 |
Amino acid frequency
Ala |
Cys |
Asp |
Glu |
Phe |
Gly |
His |
Ile |
Lys |
Leu |
|---|---|---|---|---|---|---|---|---|---|
8.402 ± 0.403 | 1.078 ± 0.151 |
5.779 ± 0.284 | 6.587 ± 0.318 |
3.964 ± 0.183 | 7.343 ± 0.409 |
1.907 ± 0.151 | 6.075 ± 0.239 |
6.035 ± 0.339 | 7.751 ± 0.345 |
Met |
Asn |
Gln |
Pro |
Arg |
Ser |
Thr |
Val |
Trp |
Tyr |
|---|---|---|---|---|---|---|---|---|---|
2.755 ± 0.199 | 5.036 ± 0.2 |
3.833 ± 0.151 | 3.826 ± 0.226 |
4.687 ± 0.252 | 6.725 ± 0.344 |
6.272 ± 0.372 | 6.969 ± 0.342 |
1.387 ± 0.125 | 3.59 ± 0.155 |
Most of the basic statistics you can see at this page can be downloaded from this CSV file
Proteome-pI is available under Creative Commons Attribution-NoDerivs license, for more details see here
| Reference: Kozlowski LP. Proteome-pI 2.0: Proteome Isoelectric Point Database Update. Nucleic Acids Res. 2021, doi: 10.1093/nar/gkab944 | Contact: Lukasz P. Kozlowski |
