Klebsiella phage ST405-OXA48phi1.1
Taxonomy: Viruses; Duplodnaviria; Heunggongvirae; Uroviricota; Caudoviricetes; Caudovirales; Myoviridae; unclassified Myoviridae
Average proteome isoelectric point is 6.55
Get precalculated fractions of proteins

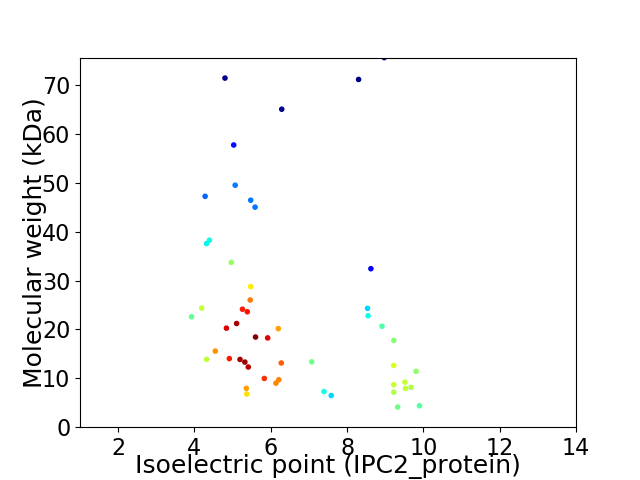
Virtual 2D-PAGE plot for 52 proteins (isoelectric point calculated using IPC2_protein)
Get csv file with sequences according to given criteria:
* You can choose from 21 different methods for calculating isoelectric point
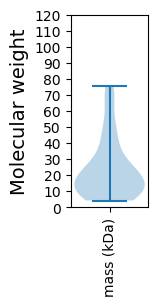
Summary statistics related to proteome-wise predictions


Protein with the lowest isoelectric point:
>tr|A0A411F007|A0A411F007_9CAUD Tail fiber assembly protein OS=Klebsiella phage ST405-OXA48phi1.1 OX=2516434 PE=3 SV=1
MM1 pKa = 7.7SDD3 pKa = 3.75DD4 pKa = 3.28IKK6 pKa = 11.42AVFDD10 pKa = 4.4SNFIATQAGSVQVFHH25 pKa = 7.0YY26 pKa = 10.6DD27 pKa = 2.91SNTRR31 pKa = 11.84EE32 pKa = 4.24FIGVEE37 pKa = 4.17DD38 pKa = 3.93IYY40 pKa = 11.76VPLGVGIPALTCLDD54 pKa = 3.88KK55 pKa = 11.28PPVQNEE61 pKa = 3.92YY62 pKa = 10.43QVAIRR67 pKa = 11.84SEE69 pKa = 4.85DD70 pKa = 3.45NSSWSVTDD78 pKa = 3.7DD79 pKa = 3.36FRR81 pKa = 11.84GITVYY86 pKa = 10.76DD87 pKa = 3.88LQTLASHH94 pKa = 7.4VITEE98 pKa = 4.81PGPIPDD104 pKa = 4.26TVTTSAPSTPYY115 pKa = 10.92DD116 pKa = 3.39KK117 pKa = 10.43WDD119 pKa = 3.3GSAWVTDD126 pKa = 3.65ADD128 pKa = 3.92AQHH131 pKa = 6.73AADD134 pKa = 4.77IAAADD139 pKa = 3.79QQKK142 pKa = 10.48KK143 pKa = 8.94EE144 pKa = 4.77LISQVTADD152 pKa = 4.05ISILQDD158 pKa = 3.21AVALNMATDD167 pKa = 3.84EE168 pKa = 4.68EE169 pKa = 4.87KK170 pKa = 10.98SQLTSLQGYY179 pKa = 8.62RR180 pKa = 11.84VLLYY184 pKa = 10.57RR185 pKa = 11.84VDD187 pKa = 3.35TSLAPDD193 pKa = 4.5IIWPVVTIQEE203 pKa = 4.4GNNVV207 pKa = 3.24
MM1 pKa = 7.7SDD3 pKa = 3.75DD4 pKa = 3.28IKK6 pKa = 11.42AVFDD10 pKa = 4.4SNFIATQAGSVQVFHH25 pKa = 7.0YY26 pKa = 10.6DD27 pKa = 2.91SNTRR31 pKa = 11.84EE32 pKa = 4.24FIGVEE37 pKa = 4.17DD38 pKa = 3.93IYY40 pKa = 11.76VPLGVGIPALTCLDD54 pKa = 3.88KK55 pKa = 11.28PPVQNEE61 pKa = 3.92YY62 pKa = 10.43QVAIRR67 pKa = 11.84SEE69 pKa = 4.85DD70 pKa = 3.45NSSWSVTDD78 pKa = 3.7DD79 pKa = 3.36FRR81 pKa = 11.84GITVYY86 pKa = 10.76DD87 pKa = 3.88LQTLASHH94 pKa = 7.4VITEE98 pKa = 4.81PGPIPDD104 pKa = 4.26TVTTSAPSTPYY115 pKa = 10.92DD116 pKa = 3.39KK117 pKa = 10.43WDD119 pKa = 3.3GSAWVTDD126 pKa = 3.65ADD128 pKa = 3.92AQHH131 pKa = 6.73AADD134 pKa = 4.77IAAADD139 pKa = 3.79QQKK142 pKa = 10.48KK143 pKa = 8.94EE144 pKa = 4.77LISQVTADD152 pKa = 4.05ISILQDD158 pKa = 3.21AVALNMATDD167 pKa = 3.84EE168 pKa = 4.68EE169 pKa = 4.87KK170 pKa = 10.98SQLTSLQGYY179 pKa = 8.62RR180 pKa = 11.84VLLYY184 pKa = 10.57RR185 pKa = 11.84VDD187 pKa = 3.35TSLAPDD193 pKa = 4.5IIWPVVTIQEE203 pKa = 4.4GNNVV207 pKa = 3.24
Molecular weight: 22.59 kDa
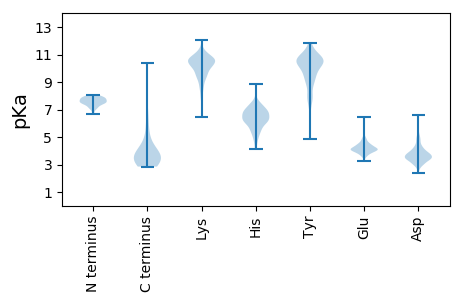
Isoelectric point according different methods:
Protein with the highest isoelectric point:
>tr|A0A411EZR2|A0A411EZR2_9CAUD Uncharacterized protein OS=Klebsiella phage ST405-OXA48phi1.1 OX=2516434 PE=4 SV=1
MM1 pKa = 7.8AIIEE5 pKa = 4.25ISVSRR10 pKa = 11.84RR11 pKa = 11.84GKK13 pKa = 9.26GVQVRR18 pKa = 11.84TRR20 pKa = 11.84MVRR23 pKa = 11.84NDD25 pKa = 3.86DD26 pKa = 3.73DD27 pKa = 4.93SEE29 pKa = 4.35LVRR32 pKa = 11.84NTAKK36 pKa = 10.47RR37 pKa = 11.84IHH39 pKa = 6.23MSLGGFIHH47 pKa = 6.76GLVARR52 pKa = 11.84IFAKK56 pKa = 10.61VEE58 pKa = 4.23NISPSPADD66 pKa = 3.73KK67 pKa = 11.44NNIHH71 pKa = 6.73
MM1 pKa = 7.8AIIEE5 pKa = 4.25ISVSRR10 pKa = 11.84RR11 pKa = 11.84GKK13 pKa = 9.26GVQVRR18 pKa = 11.84TRR20 pKa = 11.84MVRR23 pKa = 11.84NDD25 pKa = 3.86DD26 pKa = 3.73DD27 pKa = 4.93SEE29 pKa = 4.35LVRR32 pKa = 11.84NTAKK36 pKa = 10.47RR37 pKa = 11.84IHH39 pKa = 6.23MSLGGFIHH47 pKa = 6.76GLVARR52 pKa = 11.84IFAKK56 pKa = 10.61VEE58 pKa = 4.23NISPSPADD66 pKa = 3.73KK67 pKa = 11.44NNIHH71 pKa = 6.73
Molecular weight: 7.92 kDa
Isoelectric point according different methods:
Peptides (in silico digests for buttom-up proteomics)
Below you can find in silico digests of the whole proteome with Trypsin, Chymotrypsin, Trypsin+LysC, LysN, ArgC proteases suitable for different mass spec machines.| Try ESI |
 |
|---|
| ChTry ESI |
 |
|---|
| ArgC ESI |
 |
|---|
| LysN ESI |
 |
|---|
| TryLysC ESI |
 |
|---|
| Try MALDI |
 |
|---|
| ChTry MALDI |
 |
|---|
| ArgC MALDI |
 |
|---|
| LysN MALDI |
 |
|---|
| TryLysC MALDI |
 |
|---|
| Try LTQ |
 |
|---|
| ChTry LTQ |
 |
|---|
| ArgC LTQ |
 |
|---|
| LysN LTQ |
 |
|---|
| TryLysC LTQ |
 |
|---|
| Try MSlow |
 |
|---|
| ChTry MSlow |
 |
|---|
| ArgC MSlow |
 |
|---|
| LysN MSlow |
 |
|---|
| TryLysC MSlow |
 |
|---|
| Try MShigh |
 |
|---|
| ChTry MShigh |
 |
|---|
| ArgC MShigh |
 |
|---|
| LysN MShigh |
 |
|---|
| TryLysC MShigh |
 |
|---|
General Statistics
Number of major isoforms |
Number of additional isoforms |
Number of all proteins |
Number of amino acids |
Min. Seq. Length |
Max. Seq. Length |
Avg. Seq. Length |
Avg. Mol. Weight |
|---|---|---|---|---|---|---|---|
0 |
11294 |
33 |
712 |
217.2 |
23.94 |
Amino acid frequency
Ala |
Cys |
Asp |
Glu |
Phe |
Gly |
His |
Ile |
Lys |
Leu |
|---|---|---|---|---|---|---|---|---|---|
10.236 ± 0.49 | 0.726 ± 0.085 |
6.446 ± 0.27 | 5.64 ± 0.265 |
3.223 ± 0.199 | 7.42 ± 0.404 |
1.647 ± 0.175 | 5.463 ± 0.254 |
4.277 ± 0.278 | 9.102 ± 0.344 |
Met |
Asn |
Gln |
Pro |
Arg |
Ser |
Thr |
Val |
Trp |
Tyr |
|---|---|---|---|---|---|---|---|---|---|
2.523 ± 0.154 | 3.976 ± 0.253 |
4.418 ± 0.173 | 4.507 ± 0.305 |
6.552 ± 0.331 | 6.897 ± 0.29 |
5.959 ± 0.373 | 6.614 ± 0.305 |
1.532 ± 0.13 | 2.842 ± 0.189 |
Most of the basic statistics you can see at this page can be downloaded from this CSV file
Proteome-pI is available under Creative Commons Attribution-NoDerivs license, for more details see here
| Reference: Kozlowski LP. Proteome-pI 2.0: Proteome Isoelectric Point Database Update. Nucleic Acids Res. 2021, doi: 10.1093/nar/gkab944 | Contact: Lukasz P. Kozlowski |
