Bacillus phage Moonbeam
Taxonomy: Viruses; Duplodnaviria; Heunggongvirae; Uroviricota; Caudoviricetes; Caudovirales; Herelleviridae; Bastillevirinae; Moonbeamvirus; Bacillus virus Moonbeam
Average proteome isoelectric point is 6.15
Get precalculated fractions of proteins

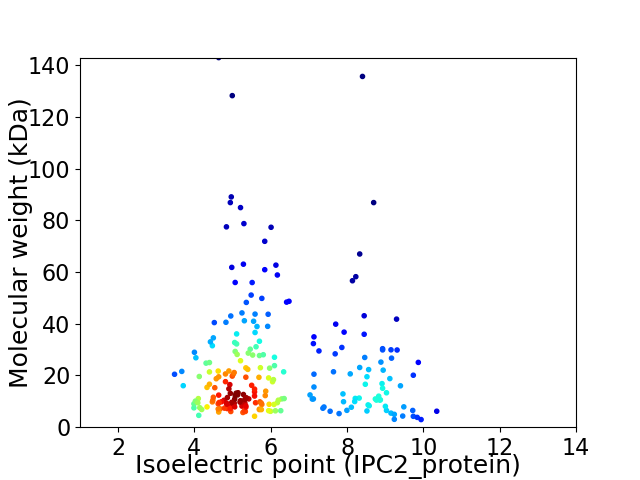
Virtual 2D-PAGE plot for 231 proteins (isoelectric point calculated using IPC2_protein)
Get csv file with sequences according to given criteria:
* You can choose from 21 different methods for calculating isoelectric point
Summary statistics related to proteome-wise predictions


Protein with the lowest isoelectric point:
>tr|A0A0A0RP94|A0A0A0RP94_9CAUD Pectate_lyase_3 domain-containing protein OS=Bacillus phage Moonbeam OX=1540091 GN=CPT_Moonbeam51 PE=4 SV=1
MM1 pKa = 7.48FGFTEE6 pKa = 4.96HH7 pKa = 6.04EE8 pKa = 3.88MEE10 pKa = 4.4MYY12 pKa = 10.41QDD14 pKa = 3.52AVQAFAIEE22 pKa = 4.15EE23 pKa = 4.19VATNIVEE30 pKa = 4.07NSKK33 pKa = 10.46FVAPATEE40 pKa = 4.02QNGKK44 pKa = 9.54IVVSDD49 pKa = 3.81RR50 pKa = 11.84FVQGVFNDD58 pKa = 3.56VQTVITITAAAMAYY72 pKa = 9.59EE73 pKa = 4.21YY74 pKa = 11.43AFLQDD79 pKa = 4.26DD80 pKa = 4.52GEE82 pKa = 4.55TTEE85 pKa = 4.72EE86 pKa = 3.64DD87 pKa = 4.35TIAHH91 pKa = 6.99LHH93 pKa = 5.46TKK95 pKa = 10.13YY96 pKa = 10.13EE97 pKa = 4.06SHH99 pKa = 8.12LIRR102 pKa = 11.84QFINYY107 pKa = 9.67SIVFTEE113 pKa = 4.57DD114 pKa = 3.12VLPVIVSEE122 pKa = 4.94LVMEE126 pKa = 4.46MPYY129 pKa = 10.64LYY131 pKa = 10.71AAARR135 pKa = 11.84SSDD138 pKa = 3.57EE139 pKa = 4.12FDD141 pKa = 5.25DD142 pKa = 4.22EE143 pKa = 5.1LFLEE147 pKa = 4.62EE148 pKa = 4.98RR149 pKa = 11.84LAAYY153 pKa = 8.71TEE155 pKa = 4.24YY156 pKa = 10.96LDD158 pKa = 4.1SNFYY162 pKa = 10.48EE163 pKa = 4.33YY164 pKa = 11.03SGLDD168 pKa = 3.38DD169 pKa = 5.54YY170 pKa = 12.08EE171 pKa = 6.2DD172 pKa = 4.23FDD174 pKa = 4.85EE175 pKa = 6.94DD176 pKa = 3.67EE177 pKa = 5.34AEE179 pKa = 4.18LNEE182 pKa = 5.44DD183 pKa = 4.99DD184 pKa = 5.37FDD186 pKa = 4.08EE187 pKa = 4.63
MM1 pKa = 7.48FGFTEE6 pKa = 4.96HH7 pKa = 6.04EE8 pKa = 3.88MEE10 pKa = 4.4MYY12 pKa = 10.41QDD14 pKa = 3.52AVQAFAIEE22 pKa = 4.15EE23 pKa = 4.19VATNIVEE30 pKa = 4.07NSKK33 pKa = 10.46FVAPATEE40 pKa = 4.02QNGKK44 pKa = 9.54IVVSDD49 pKa = 3.81RR50 pKa = 11.84FVQGVFNDD58 pKa = 3.56VQTVITITAAAMAYY72 pKa = 9.59EE73 pKa = 4.21YY74 pKa = 11.43AFLQDD79 pKa = 4.26DD80 pKa = 4.52GEE82 pKa = 4.55TTEE85 pKa = 4.72EE86 pKa = 3.64DD87 pKa = 4.35TIAHH91 pKa = 6.99LHH93 pKa = 5.46TKK95 pKa = 10.13YY96 pKa = 10.13EE97 pKa = 4.06SHH99 pKa = 8.12LIRR102 pKa = 11.84QFINYY107 pKa = 9.67SIVFTEE113 pKa = 4.57DD114 pKa = 3.12VLPVIVSEE122 pKa = 4.94LVMEE126 pKa = 4.46MPYY129 pKa = 10.64LYY131 pKa = 10.71AAARR135 pKa = 11.84SSDD138 pKa = 3.57EE139 pKa = 4.12FDD141 pKa = 5.25DD142 pKa = 4.22EE143 pKa = 5.1LFLEE147 pKa = 4.62EE148 pKa = 4.98RR149 pKa = 11.84LAAYY153 pKa = 8.71TEE155 pKa = 4.24YY156 pKa = 10.96LDD158 pKa = 4.1SNFYY162 pKa = 10.48EE163 pKa = 4.33YY164 pKa = 11.03SGLDD168 pKa = 3.38DD169 pKa = 5.54YY170 pKa = 12.08EE171 pKa = 6.2DD172 pKa = 4.23FDD174 pKa = 4.85EE175 pKa = 6.94DD176 pKa = 3.67EE177 pKa = 5.34AEE179 pKa = 4.18LNEE182 pKa = 5.44DD183 pKa = 4.99DD184 pKa = 5.37FDD186 pKa = 4.08EE187 pKa = 4.63
Molecular weight: 21.58 kDa
Isoelectric point according different methods:
Protein with the highest isoelectric point:
>tr|A0A0A0RN74|A0A0A0RN74_9CAUD DNA recombination and repair protein OS=Bacillus phage Moonbeam OX=1540091 GN=CPT_Moonbeam127 PE=3 SV=1
MM1 pKa = 7.43FKK3 pKa = 10.65FIVYY7 pKa = 10.04LAFCVASGIGIGQALSTYY25 pKa = 10.62LKK27 pKa = 9.71LTGSIHH33 pKa = 6.61RR34 pKa = 11.84SVVALAFIACGIFATSLQRR53 pKa = 11.84IFYY56 pKa = 9.69GGKK59 pKa = 9.17RR60 pKa = 3.4
MM1 pKa = 7.43FKK3 pKa = 10.65FIVYY7 pKa = 10.04LAFCVASGIGIGQALSTYY25 pKa = 10.62LKK27 pKa = 9.71LTGSIHH33 pKa = 6.61RR34 pKa = 11.84SVVALAFIACGIFATSLQRR53 pKa = 11.84IFYY56 pKa = 9.69GGKK59 pKa = 9.17RR60 pKa = 3.4
Molecular weight: 6.48 kDa
Isoelectric point according different methods:
Peptides (in silico digests for buttom-up proteomics)
Below you can find in silico digests of the whole proteome with Trypsin, Chymotrypsin, Trypsin+LysC, LysN, ArgC proteases suitable for different mass spec machines.| Try ESI |
 |
|---|
| ChTry ESI |
 |
|---|
| ArgC ESI |
 |
|---|
| LysN ESI |
 |
|---|
| TryLysC ESI |
 |
|---|
| Try MALDI |
 |
|---|
| ChTry MALDI |
 |
|---|
| ArgC MALDI |
 |
|---|
| LysN MALDI |
 |
|---|
| TryLysC MALDI |
 |
|---|
| Try LTQ |
 |
|---|
| ChTry LTQ |
 |
|---|
| ArgC LTQ |
 |
|---|
| LysN LTQ |
 |
|---|
| TryLysC LTQ |
 |
|---|
| Try MSlow |
 |
|---|
| ChTry MSlow |
 |
|---|
| ArgC MSlow |
 |
|---|
| LysN MSlow |
 |
|---|
| TryLysC MSlow |
 |
|---|
| Try MShigh |
 |
|---|
| ChTry MShigh |
 |
|---|
| ArgC MShigh |
 |
|---|
| LysN MShigh |
 |
|---|
| TryLysC MShigh |
 |
|---|
General Statistics
Number of major isoforms |
Number of additional isoforms |
Number of all proteins |
Number of amino acids |
Min. Seq. Length |
Max. Seq. Length |
Avg. Seq. Length |
Avg. Mol. Weight |
|---|---|---|---|---|---|---|---|
0 |
47869 |
27 |
1301 |
207.2 |
23.43 |
Amino acid frequency
Ala |
Cys |
Asp |
Glu |
Phe |
Gly |
His |
Ile |
Lys |
Leu |
|---|---|---|---|---|---|---|---|---|---|
6.491 ± 0.168 | 0.815 ± 0.069 |
6.171 ± 0.119 | 7.629 ± 0.316 |
3.877 ± 0.088 | 6.631 ± 0.258 |
1.801 ± 0.091 | 6.286 ± 0.152 |
7.767 ± 0.242 | 8.195 ± 0.172 |
Met |
Asn |
Gln |
Pro |
Arg |
Ser |
Thr |
Val |
Trp |
Tyr |
|---|---|---|---|---|---|---|---|---|---|
2.549 ± 0.098 | 5.415 ± 0.146 |
3.315 ± 0.154 | 3.731 ± 0.13 |
4.341 ± 0.133 | 5.872 ± 0.17 |
6.672 ± 0.242 | 6.927 ± 0.18 |
1.049 ± 0.056 | 4.466 ± 0.145 |
Most of the basic statistics you can see at this page can be downloaded from this CSV file
Proteome-pI is available under Creative Commons Attribution-NoDerivs license, for more details see here
| Reference: Kozlowski LP. Proteome-pI 2.0: Proteome Isoelectric Point Database Update. Nucleic Acids Res. 2021, doi: 10.1093/nar/gkab944 | Contact: Lukasz P. Kozlowski |
