Mycobacterium phage Fulbright
Taxonomy: Viruses; Duplodnaviria; Heunggongvirae; Uroviricota; Caudoviricetes; Caudovirales; Siphoviridae; Nclasvirinae; Charlievirus; unclassified Charlievirus
Average proteome isoelectric point is 5.96
Get precalculated fractions of proteins
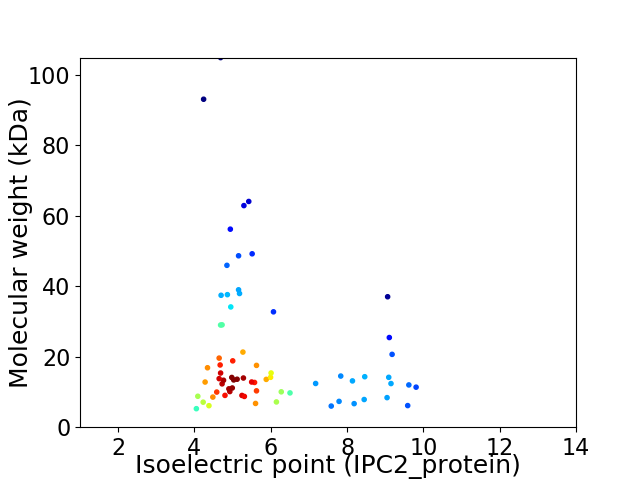
Virtual 2D-PAGE plot for 70 proteins (isoelectric point calculated using IPC2_protein)
Get csv file with sequences according to given criteria:
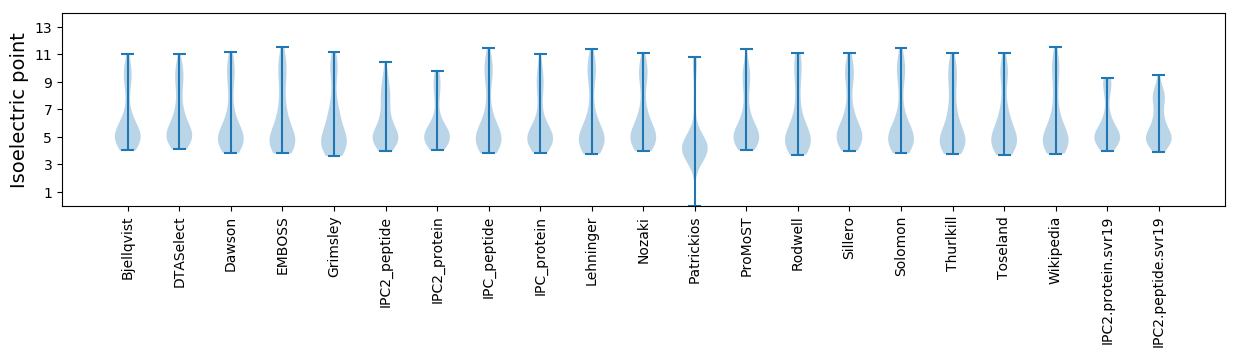
* You can choose from 21 different methods for calculating isoelectric point
Summary statistics related to proteome-wise predictions

Protein with the lowest isoelectric point:
>tr|A0A4Y6EP72|A0A4Y6EP72_9CAUD HNH endonuclease OS=Mycobacterium phage Fulbright OX=2588511 GN=70 PE=4 SV=1
MM1 pKa = 7.47LPDD4 pKa = 4.77CALCGCPYY12 pKa = 10.63HH13 pKa = 7.24EE14 pKa = 4.9DD15 pKa = 3.27RR16 pKa = 11.84CRR18 pKa = 11.84TVVGAAEE25 pKa = 4.44YY26 pKa = 10.38IFGYY30 pKa = 10.85LPMFCDD36 pKa = 3.66CPGYY40 pKa = 10.42EE41 pKa = 4.28EE42 pKa = 5.72PEE44 pKa = 4.33DD45 pKa = 3.68ATT47 pKa = 4.17
MM1 pKa = 7.47LPDD4 pKa = 4.77CALCGCPYY12 pKa = 10.63HH13 pKa = 7.24EE14 pKa = 4.9DD15 pKa = 3.27RR16 pKa = 11.84CRR18 pKa = 11.84TVVGAAEE25 pKa = 4.44YY26 pKa = 10.38IFGYY30 pKa = 10.85LPMFCDD36 pKa = 3.66CPGYY40 pKa = 10.42EE41 pKa = 4.28EE42 pKa = 5.72PEE44 pKa = 4.33DD45 pKa = 3.68ATT47 pKa = 4.17
Molecular weight: 5.25 kDa
Isoelectric point according different methods:
Protein with the highest isoelectric point:
>tr|A0A4Y6EVC2|A0A4Y6EVC2_9CAUD Uncharacterized protein OS=Mycobacterium phage Fulbright OX=2588511 GN=62 PE=4 SV=1
MM1 pKa = 6.95MAAATLTEE9 pKa = 4.06DD10 pKa = 4.44QRR12 pKa = 11.84WLLYY16 pKa = 9.56VAARR20 pKa = 11.84HH21 pKa = 5.28VMPIALLDD29 pKa = 3.78PDD31 pKa = 3.78YY32 pKa = 11.27GIRR35 pKa = 11.84GLKK38 pKa = 9.9ASHH41 pKa = 6.58GSPRR45 pKa = 11.84TFRR48 pKa = 11.84RR49 pKa = 11.84IFGRR53 pKa = 11.84CC54 pKa = 2.98
MM1 pKa = 6.95MAAATLTEE9 pKa = 4.06DD10 pKa = 4.44QRR12 pKa = 11.84WLLYY16 pKa = 9.56VAARR20 pKa = 11.84HH21 pKa = 5.28VMPIALLDD29 pKa = 3.78PDD31 pKa = 3.78YY32 pKa = 11.27GIRR35 pKa = 11.84GLKK38 pKa = 9.9ASHH41 pKa = 6.58GSPRR45 pKa = 11.84TFRR48 pKa = 11.84RR49 pKa = 11.84IFGRR53 pKa = 11.84CC54 pKa = 2.98
Molecular weight: 6.13 kDa
Isoelectric point according different methods:
Peptides (in silico digests for buttom-up proteomics)
Below you can find in silico digests of the whole proteome with Trypsin, Chymotrypsin, Trypsin+LysC, LysN, ArgC proteases suitable for different mass spec machines.| Try ESI |
 |
|---|
| ChTry ESI |
|
|---|
| ArgC ESI |
|
|---|
| LysN ESI |
|
|---|
| TryLysC ESI |
|
|---|
| Try MALDI |
|
|---|
| ChTry MALDI |
|
|---|
| ArgC MALDI |
|
|---|
| LysN MALDI |
|
|---|
| TryLysC MALDI |
|
|---|
| Try LTQ |
|
|---|
| ChTry LTQ |
|
|---|
| ArgC LTQ |
|
|---|
| LysN LTQ |
|
|---|
| TryLysC LTQ |
|
|---|
| Try MSlow |
|
|---|
| ChTry MSlow |
|
|---|
| ArgC MSlow |
|
|---|
| LysN MSlow |
|
|---|
| TryLysC MSlow |
|
|---|
| Try MShigh |
|
|---|
| ChTry MShigh |
|
|---|
| ArgC MShigh |
|
|---|
| LysN MShigh |
|
|---|
| TryLysC MShigh |
|
|---|
General Statistics
Number of major isoforms |
Number of additional isoforms |
Number of all proteins |
Number of amino acids |
Min. Seq. Length |
Max. Seq. Length |
Avg. Seq. Length |
Avg. Mol. Weight |
|---|---|---|---|---|---|---|---|
0 |
13672 |
47 |
1046 |
195.3 |
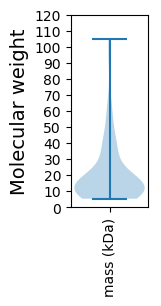
21.18 |
Amino acid frequency
Ala |
Cys |
Asp |
Glu |
Phe |
Gly |
His |
Ile |
Lys |
Leu |
|---|---|---|---|---|---|---|---|---|---|
12.178 ± 0.704 | 1.178 ± 0.155 |
6.736 ± 0.229 | 5.705 ± 0.333 |
2.809 ± 0.193 | 8.74 ± 0.449 |
2.092 ± 0.183 | 4.506 ± 0.171 |
2.911 ± 0.213 | 7.68 ± 0.233 |
Met |
Asn |
Gln |
Pro |
Arg |
Ser |
Thr |
Val |
Trp |
Tyr |
|---|---|---|---|---|---|---|---|---|---|
2.077 ± 0.147 | 3.065 ± 0.239 |
5.749 ± 0.272 | 3.825 ± 0.215 |
7.022 ± 0.43 | 5.237 ± 0.187 |
6.949 ± 0.297 | 7.3 ± 0.254 |
1.865 ± 0.135 | 2.377 ± 0.154 |
Most of the basic statistics you can see at this page can be downloaded from this CSV file
See this proteome in:

Proteome-pI is available under Creative Commons Attribution-NoDerivs license, for more details see here
| Reference: Kozlowski LP. Proteome-pI 2.0: Proteome Isoelectric Point Database Update. Nucleic Acids Res. 2021, doi: 10.1093/nar/gkab944 | Contact: Lukasz P. Kozlowski |