Klebsiella phage KMI5
Taxonomy: Viruses; Duplodnaviria; Heunggongvirae; Uroviricota; Caudoviricetes; Caudovirales; Autographiviridae; Slopekvirinae; Drulisvirus; unclassified Drulisvirus
Average proteome isoelectric point is 6.42
Get precalculated fractions of proteins

Virtual 2D-PAGE plot for 50 proteins (isoelectric point calculated using IPC2_protein)
Get csv file with sequences according to given criteria:
* You can choose from 21 different methods for calculating isoelectric point
Summary statistics related to proteome-wise predictions


Protein with the lowest isoelectric point:
>tr|A0A5B9N7V1|A0A5B9N7V1_9CAUD Uncharacterized protein OS=Klebsiella phage KMI5 OX=2601616 GN=KMI5_35 PE=4 SV=1
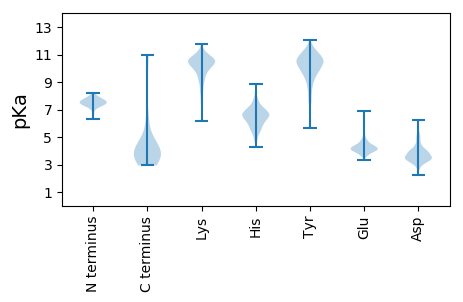
MM1 pKa = 7.75IKK3 pKa = 10.43PGDD6 pKa = 3.73IVEE9 pKa = 4.16MLEE12 pKa = 5.24LGPEE16 pKa = 4.42PIGPEE21 pKa = 3.66LSSYY25 pKa = 9.24FVPGSQHH32 pKa = 6.5RR33 pKa = 11.84VISYY37 pKa = 10.58CEE39 pKa = 3.92EE40 pKa = 3.7TWEE43 pKa = 4.73VEE45 pKa = 5.53LIDD48 pKa = 3.81PTNGSEE54 pKa = 4.2EE55 pKa = 4.37PGDD58 pKa = 4.17GITFFPGEE66 pKa = 3.93YY67 pKa = 10.18KK68 pKa = 10.88LIVEE72 pKa = 4.84
MM1 pKa = 7.75IKK3 pKa = 10.43PGDD6 pKa = 3.73IVEE9 pKa = 4.16MLEE12 pKa = 5.24LGPEE16 pKa = 4.42PIGPEE21 pKa = 3.66LSSYY25 pKa = 9.24FVPGSQHH32 pKa = 6.5RR33 pKa = 11.84VISYY37 pKa = 10.58CEE39 pKa = 3.92EE40 pKa = 3.7TWEE43 pKa = 4.73VEE45 pKa = 5.53LIDD48 pKa = 3.81PTNGSEE54 pKa = 4.2EE55 pKa = 4.37PGDD58 pKa = 4.17GITFFPGEE66 pKa = 3.93YY67 pKa = 10.18KK68 pKa = 10.88LIVEE72 pKa = 4.84
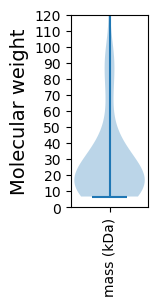
Molecular weight: 8.01 kDa
Isoelectric point according different methods:
Protein with the highest isoelectric point:
>tr|A0A5B9N7S4|A0A5B9N7S4_9CAUD Uncharacterized protein OS=Klebsiella phage KMI5 OX=2601616 GN=KMI5_5 PE=4 SV=1
MM1 pKa = 7.77AEE3 pKa = 4.03NNRR6 pKa = 11.84ATVVYY11 pKa = 10.5DD12 pKa = 3.41EE13 pKa = 4.97TSPSGLRR20 pKa = 11.84YY21 pKa = 6.72TASRR25 pKa = 11.84FKK27 pKa = 11.14SRR29 pKa = 11.84IGAPAGALNSKK40 pKa = 9.98GYY42 pKa = 10.5YY43 pKa = 9.6DD44 pKa = 5.02LRR46 pKa = 11.84SAPSGCNSRR55 pKa = 11.84MAHH58 pKa = 4.77AVVWEE63 pKa = 4.08LHH65 pKa = 6.34NGDD68 pKa = 4.31IPDD71 pKa = 4.01GLEE74 pKa = 3.58VDD76 pKa = 5.23HH77 pKa = 7.81IDD79 pKa = 4.61GNPSNNRR86 pKa = 11.84IEE88 pKa = 4.27NLRR91 pKa = 11.84LATRR95 pKa = 11.84ALQAFNRR102 pKa = 11.84GVRR105 pKa = 11.84TDD107 pKa = 3.46KK108 pKa = 11.06RR109 pKa = 11.84SGLPKK114 pKa = 10.41GVFVNGAGFMGRR126 pKa = 11.84TSRR129 pKa = 11.84DD130 pKa = 2.72GVRR133 pKa = 11.84ISKK136 pKa = 8.82TFDD139 pKa = 3.65NIEE142 pKa = 3.8EE143 pKa = 3.93AAIWVAEE150 pKa = 3.93ARR152 pKa = 11.84RR153 pKa = 11.84VSARR157 pKa = 11.84AWVRR161 pKa = 11.84SS162 pKa = 3.63
MM1 pKa = 7.77AEE3 pKa = 4.03NNRR6 pKa = 11.84ATVVYY11 pKa = 10.5DD12 pKa = 3.41EE13 pKa = 4.97TSPSGLRR20 pKa = 11.84YY21 pKa = 6.72TASRR25 pKa = 11.84FKK27 pKa = 11.14SRR29 pKa = 11.84IGAPAGALNSKK40 pKa = 9.98GYY42 pKa = 10.5YY43 pKa = 9.6DD44 pKa = 5.02LRR46 pKa = 11.84SAPSGCNSRR55 pKa = 11.84MAHH58 pKa = 4.77AVVWEE63 pKa = 4.08LHH65 pKa = 6.34NGDD68 pKa = 4.31IPDD71 pKa = 4.01GLEE74 pKa = 3.58VDD76 pKa = 5.23HH77 pKa = 7.81IDD79 pKa = 4.61GNPSNNRR86 pKa = 11.84IEE88 pKa = 4.27NLRR91 pKa = 11.84LATRR95 pKa = 11.84ALQAFNRR102 pKa = 11.84GVRR105 pKa = 11.84TDD107 pKa = 3.46KK108 pKa = 11.06RR109 pKa = 11.84SGLPKK114 pKa = 10.41GVFVNGAGFMGRR126 pKa = 11.84TSRR129 pKa = 11.84DD130 pKa = 2.72GVRR133 pKa = 11.84ISKK136 pKa = 8.82TFDD139 pKa = 3.65NIEE142 pKa = 3.8EE143 pKa = 3.93AAIWVAEE150 pKa = 3.93ARR152 pKa = 11.84RR153 pKa = 11.84VSARR157 pKa = 11.84AWVRR161 pKa = 11.84SS162 pKa = 3.63
Molecular weight: 17.76 kDa
Isoelectric point according different methods:
Peptides (in silico digests for buttom-up proteomics)
Below you can find in silico digests of the whole proteome with Trypsin, Chymotrypsin, Trypsin+LysC, LysN, ArgC proteases suitable for different mass spec machines.| Try ESI |
 |
|---|
| ChTry ESI |
 |
|---|
| ArgC ESI |
 |
|---|
| LysN ESI |
 |
|---|
| TryLysC ESI |
 |
|---|
| Try MALDI |
 |
|---|
| ChTry MALDI |
 |
|---|
| ArgC MALDI |
 |
|---|
| LysN MALDI |
 |
|---|
| TryLysC MALDI |
 |
|---|
| Try LTQ |
 |
|---|
| ChTry LTQ |
 |
|---|
| ArgC LTQ |
 |
|---|
| LysN LTQ |
 |
|---|
| TryLysC LTQ |
 |
|---|
| Try MSlow |
 |
|---|
| ChTry MSlow |
 |
|---|
| ArgC MSlow |
 |
|---|
| LysN MSlow |
 |
|---|
| TryLysC MSlow |
 |
|---|
| Try MShigh |
 |
|---|
| ChTry MShigh |
 |
|---|
| ArgC MShigh |
 |
|---|
| LysN MShigh |
 |
|---|
| TryLysC MShigh |
 |
|---|
General Statistics
Number of major isoforms |
Number of additional isoforms |
Number of all proteins |
Number of amino acids |
Min. Seq. Length |
Max. Seq. Length |
Avg. Seq. Length |
Avg. Mol. Weight |
|---|---|---|---|---|---|---|---|
0 |
13557 |
65 |
1232 |
271.1 |
29.99 |
Amino acid frequency
Ala |
Cys |
Asp |
Glu |
Phe |
Gly |
His |
Ile |
Lys |
Leu |
|---|---|---|---|---|---|---|---|---|---|
10.238 ± 0.561 | 1.328 ± 0.243 |
6.13 ± 0.238 | 5.746 ± 0.317 |
3.032 ± 0.149 | 7.561 ± 0.229 |
1.822 ± 0.176 | 4.529 ± 0.199 |
4.632 ± 0.288 | 8.542 ± 0.206 |
Met |
Asn |
Gln |
Pro |
Arg |
Ser |
Thr |
Val |
Trp |
Tyr |
|---|---|---|---|---|---|---|---|---|---|
2.936 ± 0.205 | 4.168 ± 0.23 |
3.828 ± 0.244 | 4.927 ± 0.347 |
5.997 ± 0.259 | 6.38 ± 0.261 |
5.857 ± 0.257 | 7.096 ± 0.257 |
1.424 ± 0.129 | 3.828 ± 0.263 |
Most of the basic statistics you can see at this page can be downloaded from this CSV file
Proteome-pI is available under Creative Commons Attribution-NoDerivs license, for more details see here
| Reference: Kozlowski LP. Proteome-pI 2.0: Proteome Isoelectric Point Database Update. Nucleic Acids Res. 2021, doi: 10.1093/nar/gkab944 | Contact: Lukasz P. Kozlowski |
