Kamese virus
Taxonomy: Viruses; Riboviria; Orthornavirae; Negarnaviricota; Haploviricotina; Monjiviricetes; Mononegavirales; Rhabdoviridae; Alpharhabdovirinae; Hapavirus; Kamese hapavirus
Average proteome isoelectric point is 6.72
Get precalculated fractions of proteins

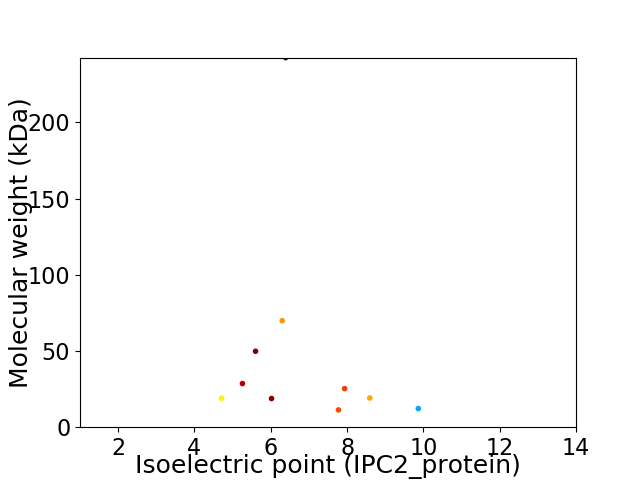
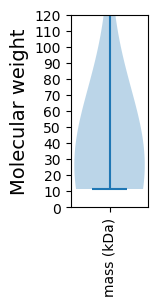
Virtual 2D-PAGE plot for 10 proteins (isoelectric point calculated using IPC2_protein)
Get csv file with sequences according to given criteria:
* You can choose from 21 different methods for calculating isoelectric point
Summary statistics related to proteome-wise predictions


Protein with the lowest isoelectric point:
>tr|A0A0D3R1J2|A0A0D3R1J2_9RHAB Matrix OS=Kamese virus OX=200402 PE=4 SV=1
MM1 pKa = 7.61KK2 pKa = 10.63LFINAGLTFNYY13 pKa = 9.75YY14 pKa = 10.5LPEE17 pKa = 4.29LPKK20 pKa = 10.84DD21 pKa = 3.64VLHH24 pKa = 6.68EE25 pKa = 4.93IISIMITRR33 pKa = 11.84CVTMSGFPEE42 pKa = 4.39DD43 pKa = 3.4LAAFAVNWTWEE54 pKa = 4.11QTQLCYY60 pKa = 10.84YY61 pKa = 10.53DD62 pKa = 4.86FDD64 pKa = 4.31VSHH67 pKa = 7.09GYY69 pKa = 9.62SWIQDD74 pKa = 4.04DD75 pKa = 4.51IEE77 pKa = 4.83LPGDD81 pKa = 3.52IKK83 pKa = 11.05SDD85 pKa = 3.51QPVLKK90 pKa = 9.49EE91 pKa = 3.59YY92 pKa = 10.57RR93 pKa = 11.84IRR95 pKa = 11.84TEE97 pKa = 3.77FPIGIDD103 pKa = 3.16RR104 pKa = 11.84NTGEE108 pKa = 4.34VEE110 pKa = 3.46FFIYY114 pKa = 10.33INTQINRR121 pKa = 11.84DD122 pKa = 3.55APHH125 pKa = 7.12WSSVWWPKK133 pKa = 11.12LMDD136 pKa = 4.61PLANYY141 pKa = 9.42LFRR144 pKa = 11.84NPDD147 pKa = 3.26QVASKK152 pKa = 11.1YY153 pKa = 10.87GFLHH157 pKa = 5.82MLYY160 pKa = 9.32TT161 pKa = 4.07
MM1 pKa = 7.61KK2 pKa = 10.63LFINAGLTFNYY13 pKa = 9.75YY14 pKa = 10.5LPEE17 pKa = 4.29LPKK20 pKa = 10.84DD21 pKa = 3.64VLHH24 pKa = 6.68EE25 pKa = 4.93IISIMITRR33 pKa = 11.84CVTMSGFPEE42 pKa = 4.39DD43 pKa = 3.4LAAFAVNWTWEE54 pKa = 4.11QTQLCYY60 pKa = 10.84YY61 pKa = 10.53DD62 pKa = 4.86FDD64 pKa = 4.31VSHH67 pKa = 7.09GYY69 pKa = 9.62SWIQDD74 pKa = 4.04DD75 pKa = 4.51IEE77 pKa = 4.83LPGDD81 pKa = 3.52IKK83 pKa = 11.05SDD85 pKa = 3.51QPVLKK90 pKa = 9.49EE91 pKa = 3.59YY92 pKa = 10.57RR93 pKa = 11.84IRR95 pKa = 11.84TEE97 pKa = 3.77FPIGIDD103 pKa = 3.16RR104 pKa = 11.84NTGEE108 pKa = 4.34VEE110 pKa = 3.46FFIYY114 pKa = 10.33INTQINRR121 pKa = 11.84DD122 pKa = 3.55APHH125 pKa = 7.12WSSVWWPKK133 pKa = 11.12LMDD136 pKa = 4.61PLANYY141 pKa = 9.42LFRR144 pKa = 11.84NPDD147 pKa = 3.26QVASKK152 pKa = 11.1YY153 pKa = 10.87GFLHH157 pKa = 5.82MLYY160 pKa = 9.32TT161 pKa = 4.07
Molecular weight: 19.02 kDa
Isoelectric point according different methods:
Protein with the highest isoelectric point:
>tr|A0A0D3R117|A0A0D3R117_9RHAB Nucleocapsid protein OS=Kamese virus OX=200402 PE=4 SV=1
MM1 pKa = 7.61GFNFDD6 pKa = 3.38VDD8 pKa = 3.8VAKK11 pKa = 10.42PIQGAFKK18 pKa = 10.71NLWNDD23 pKa = 2.65ITRR26 pKa = 11.84FFEE29 pKa = 5.43PFLTWISDD37 pKa = 3.07IGKK40 pKa = 7.92WALIILLVIVSIKK53 pKa = 10.14ILIVIYY59 pKa = 10.5KK60 pKa = 9.9IGKK63 pKa = 8.32CLWKK67 pKa = 10.68SGLCLKK73 pKa = 10.54RR74 pKa = 11.84CFRR77 pKa = 11.84RR78 pKa = 11.84IKK80 pKa = 8.76KK81 pKa = 8.08TKK83 pKa = 8.85IRR85 pKa = 11.84KK86 pKa = 8.96KK87 pKa = 10.27VSLKK91 pKa = 10.49LRR93 pKa = 11.84SKK95 pKa = 10.45RR96 pKa = 11.84IKK98 pKa = 10.11KK99 pKa = 10.03KK100 pKa = 10.69RR101 pKa = 11.84ILL103 pKa = 3.67
MM1 pKa = 7.61GFNFDD6 pKa = 3.38VDD8 pKa = 3.8VAKK11 pKa = 10.42PIQGAFKK18 pKa = 10.71NLWNDD23 pKa = 2.65ITRR26 pKa = 11.84FFEE29 pKa = 5.43PFLTWISDD37 pKa = 3.07IGKK40 pKa = 7.92WALIILLVIVSIKK53 pKa = 10.14ILIVIYY59 pKa = 10.5KK60 pKa = 9.9IGKK63 pKa = 8.32CLWKK67 pKa = 10.68SGLCLKK73 pKa = 10.54RR74 pKa = 11.84CFRR77 pKa = 11.84RR78 pKa = 11.84IKK80 pKa = 8.76KK81 pKa = 8.08TKK83 pKa = 8.85IRR85 pKa = 11.84KK86 pKa = 8.96KK87 pKa = 10.27VSLKK91 pKa = 10.49LRR93 pKa = 11.84SKK95 pKa = 10.45RR96 pKa = 11.84IKK98 pKa = 10.11KK99 pKa = 10.03KK100 pKa = 10.69RR101 pKa = 11.84ILL103 pKa = 3.67
Molecular weight: 12.21 kDa
Isoelectric point according different methods:
Peptides (in silico digests for buttom-up proteomics)
Below you can find in silico digests of the whole proteome with Trypsin, Chymotrypsin, Trypsin+LysC, LysN, ArgC proteases suitable for different mass spec machines.| Try ESI |
 |
|---|
| ChTry ESI |
 |
|---|
| ArgC ESI |
 |
|---|
| LysN ESI |
 |
|---|
| TryLysC ESI |
 |
|---|
| Try MALDI |
 |
|---|
| ChTry MALDI |
 |
|---|
| ArgC MALDI |
 |
|---|
| LysN MALDI |
 |
|---|
| TryLysC MALDI |
 |
|---|
| Try LTQ |
 |
|---|
| ChTry LTQ |
 |
|---|
| ArgC LTQ |
 |
|---|
| LysN LTQ |
 |
|---|
| TryLysC LTQ |
 |
|---|
| Try MSlow |
 |
|---|
| ChTry MSlow |
 |
|---|
| ArgC MSlow |
 |
|---|
| LysN MSlow |
 |
|---|
| TryLysC MSlow |
 |
|---|
| Try MShigh |
 |
|---|
| ChTry MShigh |
 |
|---|
| ArgC MShigh |
 |
|---|
| LysN MShigh |
 |
|---|
| TryLysC MShigh |
 |
|---|
General Statistics
Number of major isoforms |
Number of additional isoforms |
Number of all proteins |
Number of amino acids |
Min. Seq. Length |
Max. Seq. Length |
Avg. Seq. Length |
Avg. Mol. Weight |
|---|---|---|---|---|---|---|---|
0 |
4319 |
100 |
2104 |
431.9 |
49.66 |
Amino acid frequency
Ala |
Cys |
Asp |
Glu |
Phe |
Gly |
His |
Ile |
Lys |
Leu |
|---|---|---|---|---|---|---|---|---|---|
4.584 ± 0.677 | 1.806 ± 0.282 |
5.302 ± 0.516 | 5.858 ± 0.337 |
4.237 ± 0.327 | 5.302 ± 0.21 |
2.524 ± 0.291 | 7.293 ± 0.513 |
5.696 ± 0.747 | 10.28 ± 0.976 |
Met |
Asn |
Gln |
Pro |
Arg |
Ser |
Thr |
Val |
Trp |
Tyr |
|---|---|---|---|---|---|---|---|---|---|
2.639 ± 0.207 | 5.858 ± 0.538 |
4.538 ± 0.439 | 3.473 ± 0.294 |
5.487 ± 0.345 | 7.78 ± 0.476 |
5.464 ± 0.498 | 5.534 ± 0.251 |
2.269 ± 0.25 | 4.075 ± 0.387 |
Most of the basic statistics you can see at this page can be downloaded from this CSV file
Proteome-pI is available under Creative Commons Attribution-NoDerivs license, for more details see here
| Reference: Kozlowski LP. Proteome-pI 2.0: Proteome Isoelectric Point Database Update. Nucleic Acids Res. 2021, doi: 10.1093/nar/gkab944 | Contact: Lukasz P. Kozlowski |
