Microbacterium saperdae
Taxonomy: cellular organisms; Bacteria; Terrabacteria group; Actinobacteria; Actinomycetia; Micrococcales; Microbacteriaceae; Microbacterium
Average proteome isoelectric point is 5.96
Get precalculated fractions of proteins
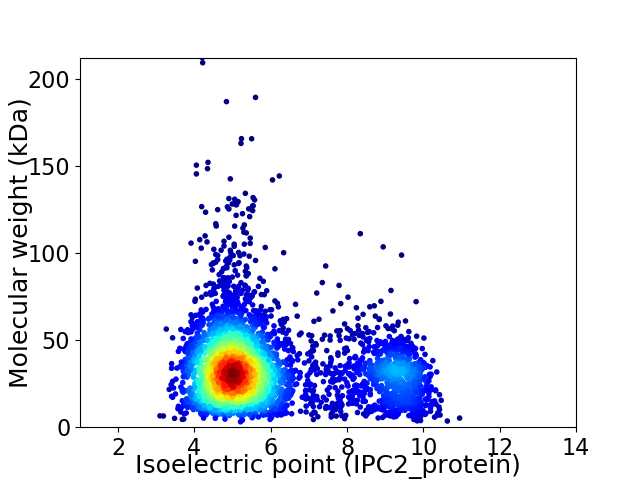
Virtual 2D-PAGE plot for 4035 proteins (isoelectric point calculated using IPC2_protein)
Get csv file with sequences according to given criteria:
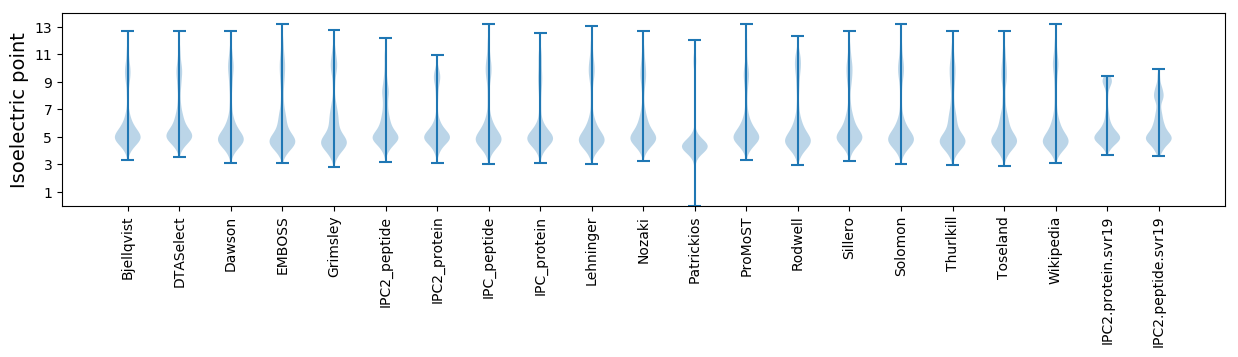
* You can choose from 21 different methods for calculating isoelectric point
Summary statistics related to proteome-wise predictions
Protein with the lowest isoelectric point:
>tr|A0A543BMZ2|A0A543BMZ2_9MICO Acyl-CoA thioesterase-2 OS=Microbacterium saperdae OX=69368 GN=FB560_1853 PE=3 SV=1
MM1 pKa = 7.56LALTAGGGAAWAADD15 pKa = 3.66RR16 pKa = 11.84FLIEE20 pKa = 4.77HH21 pKa = 6.11VSITDD26 pKa = 3.17VSAYY30 pKa = 9.22EE31 pKa = 4.02AANSNTDD38 pKa = 3.57DD39 pKa = 3.76AVTEE43 pKa = 4.46TTHH46 pKa = 6.37ATVTDD51 pKa = 3.62TSYY54 pKa = 11.82DD55 pKa = 3.4SDD57 pKa = 3.64QADD60 pKa = 3.08ISISTVSTGSGDD72 pKa = 3.66DD73 pKa = 3.24TVTYY77 pKa = 10.12YY78 pKa = 11.05VADD81 pKa = 3.68VTLTDD86 pKa = 3.48ATALRR91 pKa = 11.84SAFAGDD97 pKa = 3.42AFGTNITEE105 pKa = 4.24TTSAIAAANDD115 pKa = 3.27AVFAINGDD123 pKa = 3.82YY124 pKa = 11.18YY125 pKa = 11.16GFRR128 pKa = 11.84DD129 pKa = 3.52TGIVIRR135 pKa = 11.84NGVAYY140 pKa = 9.73RR141 pKa = 11.84DD142 pKa = 3.32AGARR146 pKa = 11.84EE147 pKa = 4.06GLAFYY152 pKa = 10.75QDD154 pKa = 3.69GHH156 pKa = 7.51VEE158 pKa = 4.48LYY160 pKa = 11.05DD161 pKa = 3.71EE162 pKa = 4.67TATTAASLVADD173 pKa = 4.55GVWNTLSFGPALVEE187 pKa = 4.12DD188 pKa = 4.77SIVVDD193 pKa = 4.98GIEE196 pKa = 4.24EE197 pKa = 4.28IEE199 pKa = 3.99VDD201 pKa = 3.95TNFGNHH207 pKa = 6.69SIQGEE212 pKa = 4.24QPRR215 pKa = 11.84TAVGVIDD222 pKa = 4.18EE223 pKa = 4.26NHH225 pKa = 6.03LVFVVVDD232 pKa = 4.11GRR234 pKa = 11.84SAGYY238 pKa = 10.01SRR240 pKa = 11.84GVTMTEE246 pKa = 4.0LADD249 pKa = 3.45IMISLGAEE257 pKa = 3.59TAYY260 pKa = 11.22NLDD263 pKa = 3.93GGGSSTMYY271 pKa = 10.7FDD273 pKa = 5.04GEE275 pKa = 4.62LVNSPLGKK283 pKa = 9.81DD284 pKa = 3.42QEE286 pKa = 4.51RR287 pKa = 11.84ATSDD291 pKa = 2.72ILYY294 pKa = 10.05IAGSGQQ300 pKa = 3.03
MM1 pKa = 7.56LALTAGGGAAWAADD15 pKa = 3.66RR16 pKa = 11.84FLIEE20 pKa = 4.77HH21 pKa = 6.11VSITDD26 pKa = 3.17VSAYY30 pKa = 9.22EE31 pKa = 4.02AANSNTDD38 pKa = 3.57DD39 pKa = 3.76AVTEE43 pKa = 4.46TTHH46 pKa = 6.37ATVTDD51 pKa = 3.62TSYY54 pKa = 11.82DD55 pKa = 3.4SDD57 pKa = 3.64QADD60 pKa = 3.08ISISTVSTGSGDD72 pKa = 3.66DD73 pKa = 3.24TVTYY77 pKa = 10.12YY78 pKa = 11.05VADD81 pKa = 3.68VTLTDD86 pKa = 3.48ATALRR91 pKa = 11.84SAFAGDD97 pKa = 3.42AFGTNITEE105 pKa = 4.24TTSAIAAANDD115 pKa = 3.27AVFAINGDD123 pKa = 3.82YY124 pKa = 11.18YY125 pKa = 11.16GFRR128 pKa = 11.84DD129 pKa = 3.52TGIVIRR135 pKa = 11.84NGVAYY140 pKa = 9.73RR141 pKa = 11.84DD142 pKa = 3.32AGARR146 pKa = 11.84EE147 pKa = 4.06GLAFYY152 pKa = 10.75QDD154 pKa = 3.69GHH156 pKa = 7.51VEE158 pKa = 4.48LYY160 pKa = 11.05DD161 pKa = 3.71EE162 pKa = 4.67TATTAASLVADD173 pKa = 4.55GVWNTLSFGPALVEE187 pKa = 4.12DD188 pKa = 4.77SIVVDD193 pKa = 4.98GIEE196 pKa = 4.24EE197 pKa = 4.28IEE199 pKa = 3.99VDD201 pKa = 3.95TNFGNHH207 pKa = 6.69SIQGEE212 pKa = 4.24QPRR215 pKa = 11.84TAVGVIDD222 pKa = 4.18EE223 pKa = 4.26NHH225 pKa = 6.03LVFVVVDD232 pKa = 4.11GRR234 pKa = 11.84SAGYY238 pKa = 10.01SRR240 pKa = 11.84GVTMTEE246 pKa = 4.0LADD249 pKa = 3.45IMISLGAEE257 pKa = 3.59TAYY260 pKa = 11.22NLDD263 pKa = 3.93GGGSSTMYY271 pKa = 10.7FDD273 pKa = 5.04GEE275 pKa = 4.62LVNSPLGKK283 pKa = 9.81DD284 pKa = 3.42QEE286 pKa = 4.51RR287 pKa = 11.84ATSDD291 pKa = 2.72ILYY294 pKa = 10.05IAGSGQQ300 pKa = 3.03
Molecular weight: 31.35 kDa
Isoelectric point according different methods:
Protein with the highest isoelectric point:
>tr|A0A543BAH2|A0A543BAH2_9MICO Putative peptidoglycan lipid II flippase OS=Microbacterium saperdae OX=69368 GN=FB560_3294 PE=4 SV=1
MM1 pKa = 7.51TKK3 pKa = 9.09RR4 pKa = 11.84TFQPNNRR11 pKa = 11.84RR12 pKa = 11.84RR13 pKa = 11.84AKK15 pKa = 10.04KK16 pKa = 8.86HH17 pKa = 4.36GFRR20 pKa = 11.84ARR22 pKa = 11.84MRR24 pKa = 11.84TRR26 pKa = 11.84AGRR29 pKa = 11.84GILAARR35 pKa = 11.84RR36 pKa = 11.84AKK38 pKa = 10.52GRR40 pKa = 11.84TEE42 pKa = 4.14LSAA45 pKa = 4.86
MM1 pKa = 7.51TKK3 pKa = 9.09RR4 pKa = 11.84TFQPNNRR11 pKa = 11.84RR12 pKa = 11.84RR13 pKa = 11.84AKK15 pKa = 10.04KK16 pKa = 8.86HH17 pKa = 4.36GFRR20 pKa = 11.84ARR22 pKa = 11.84MRR24 pKa = 11.84TRR26 pKa = 11.84AGRR29 pKa = 11.84GILAARR35 pKa = 11.84RR36 pKa = 11.84AKK38 pKa = 10.52GRR40 pKa = 11.84TEE42 pKa = 4.14LSAA45 pKa = 4.86
Molecular weight: 5.24 kDa
Isoelectric point according different methods:
Peptides (in silico digests for buttom-up proteomics)
Below you can find in silico digests of the whole proteome with Trypsin, Chymotrypsin, Trypsin+LysC, LysN, ArgC proteases suitable for different mass spec machines.| Try ESI |
 |
|---|
| ChTry ESI |
|
|---|
| ArgC ESI |
|
|---|
| LysN ESI |
|
|---|
| TryLysC ESI |
|
|---|
| Try MALDI |
|
|---|
| ChTry MALDI |
|
|---|
| ArgC MALDI |
|
|---|
| LysN MALDI |
|
|---|
| TryLysC MALDI |
|
|---|
| Try LTQ |
|
|---|
| ChTry LTQ |
|
|---|
| ArgC LTQ |
|
|---|
| LysN LTQ |
|
|---|
| TryLysC LTQ |
|
|---|
| Try MSlow |
|
|---|
| ChTry MSlow |
|
|---|
| ArgC MSlow |
|
|---|
| LysN MSlow |
|
|---|
| TryLysC MSlow |
|
|---|
| Try MShigh |
|
|---|
| ChTry MShigh |
|
|---|
| ArgC MShigh |
|
|---|
| LysN MShigh |
|
|---|
| TryLysC MShigh |
|
|---|
General Statistics
Number of major isoforms |
Number of additional isoforms |
Number of all proteins |
Number of amino acids |
Min. Seq. Length |
Max. Seq. Length |
Avg. Seq. Length |
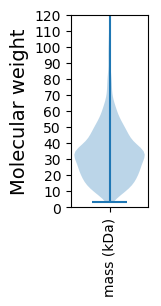
Avg. Mol. Weight |
|---|---|---|---|---|---|---|---|
0 |
1318807 |
29 |
2025 |
326.8 |
34.96 |
Amino acid frequency
Ala |
Cys |
Asp |
Glu |
Phe |
Gly |
His |
Ile |
Lys |
Leu |
|---|---|---|---|---|---|---|---|---|---|
13.457 ± 0.056 | 0.455 ± 0.008 |
6.257 ± 0.037 | 5.603 ± 0.036 |
3.181 ± 0.023 | 8.845 ± 0.03 |
1.961 ± 0.02 | 4.953 ± 0.027 |
1.847 ± 0.027 | 10.186 ± 0.048 |
Met |
Asn |
Gln |
Pro |
Arg |
Ser |
Thr |
Val |
Trp |
Tyr |
|---|---|---|---|---|---|---|---|---|---|
1.809 ± 0.015 | 1.946 ± 0.021 |
5.276 ± 0.027 | 2.816 ± 0.019 |
7.104 ± 0.045 | 5.785 ± 0.028 |
6.226 ± 0.039 | 8.82 ± 0.035 |
1.529 ± 0.015 | 1.945 ± 0.019 |
Most of the basic statistics you can see at this page can be downloaded from this CSV file
See this proteome in:

Proteome-pI is available under Creative Commons Attribution-NoDerivs license, for more details see here
| Reference: Kozlowski LP. Proteome-pI 2.0: Proteome Isoelectric Point Database Update. Nucleic Acids Res. 2021, doi: 10.1093/nar/gkab944 | Contact: Lukasz P. Kozlowski |