Drosophila rhopaloa (Fruit fly)
Taxonomy: cellular organisms; Eukaryota; Opisthokonta; Metazoa; Eumetazoa; Bilateria; Protostomia; Ecdysozoa; Panarthropoda; Arthropoda; Mandibulata; Pancrustacea; Hexapoda; Insecta; Dicondylia; Pterygota; Neoptera; Endopterygota; Diptera; Brachycera; Muscomorpha; Eremoneura; Cyclorrhapha; Schizophora;
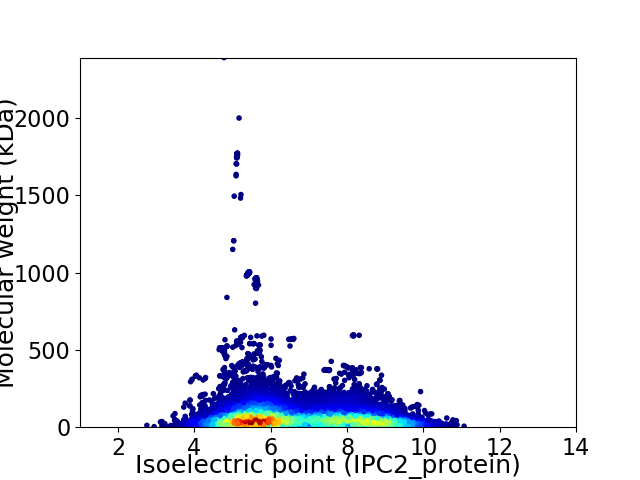
Average proteome isoelectric point is 6.68
Get precalculated fractions of proteins

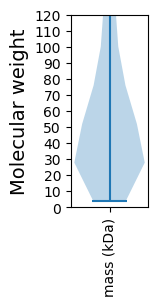
Virtual 2D-PAGE plot for 21090 proteins (isoelectric point calculated using IPC2_protein)
Get csv file with sequences according to given criteria:
* You can choose from 21 different methods for calculating isoelectric point
Summary statistics related to proteome-wise predictions


Protein with the lowest isoelectric point:
>tr|A0A6P4FGS5|A0A6P4FGS5_DRORH triple functional domain protein-like OS=Drosophila rhopaloa OX=1041015 GN=LOC108051042 PE=4 SV=1
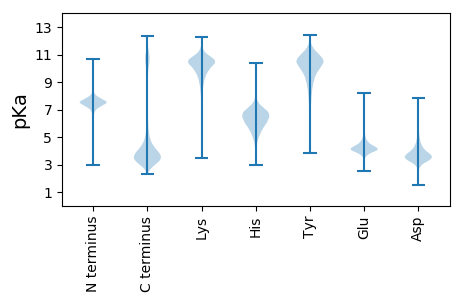
MM1 pKa = 7.86RR2 pKa = 11.84PITVNFLLVALCVSSTIWPASGLQCYY28 pKa = 9.75NCVGEE33 pKa = 4.26EE34 pKa = 4.15CHH36 pKa = 6.87AEE38 pKa = 4.07TVPEE42 pKa = 4.38ISCNLDD48 pKa = 3.17DD49 pKa = 5.76SEE51 pKa = 6.03AFVLDD56 pKa = 3.19TSGILNRR63 pKa = 11.84FRR65 pKa = 11.84RR66 pKa = 11.84SPLVVKK72 pKa = 10.41PRR74 pKa = 11.84DD75 pKa = 3.75TEE77 pKa = 4.09NLDD80 pKa = 3.31EE81 pKa = 4.48STTDD85 pKa = 3.27STVTSTDD92 pKa = 2.88ASSASTTDD100 pKa = 2.77SDD102 pKa = 4.0VTSDD106 pKa = 3.35STIASTEE113 pKa = 4.04SSSATDD119 pKa = 3.14SSTDD123 pKa = 3.06SSTNPQTVGSTEE135 pKa = 4.07SSTDD139 pKa = 2.8SSTISSTDD147 pKa = 2.82SSTATTDD154 pKa = 3.52DD155 pKa = 3.96SSTSDD160 pKa = 3.27STEE163 pKa = 3.6SSTTSEE169 pKa = 4.82PGSSSPSTTASTTDD183 pKa = 3.23STSEE187 pKa = 4.02STTDD191 pKa = 3.01STTDD195 pKa = 2.97STTDD199 pKa = 2.97STTDD203 pKa = 2.97STTDD207 pKa = 2.97STTDD211 pKa = 2.94STTDD215 pKa = 3.22STSDD219 pKa = 3.18STTDD223 pKa = 3.25STSDD227 pKa = 3.19STTDD231 pKa = 2.96STTDD235 pKa = 3.08STSQSTSSSTSSSTSDD251 pKa = 2.97STTDD255 pKa = 3.21STPNSSPVTTISPPISYY272 pKa = 10.47KK273 pKa = 10.63LAACYY278 pKa = 10.22SIYY281 pKa = 10.6KK282 pKa = 10.1EE283 pKa = 4.07GEE285 pKa = 4.01LYY287 pKa = 10.41RR288 pKa = 11.84GCIKK292 pKa = 10.76VPTNEE297 pKa = 4.32SACEE301 pKa = 3.7AVKK304 pKa = 10.81DD305 pKa = 3.83KK306 pKa = 11.88LEE308 pKa = 4.03ITEE311 pKa = 5.37DD312 pKa = 3.75SADD315 pKa = 3.4QCDD318 pKa = 3.05ICLTDD323 pKa = 3.55KK324 pKa = 11.48CNGSTSLQVSLGAMILLLAMGLKK347 pKa = 10.41NLFF350 pKa = 3.81
MM1 pKa = 7.86RR2 pKa = 11.84PITVNFLLVALCVSSTIWPASGLQCYY28 pKa = 9.75NCVGEE33 pKa = 4.26EE34 pKa = 4.15CHH36 pKa = 6.87AEE38 pKa = 4.07TVPEE42 pKa = 4.38ISCNLDD48 pKa = 3.17DD49 pKa = 5.76SEE51 pKa = 6.03AFVLDD56 pKa = 3.19TSGILNRR63 pKa = 11.84FRR65 pKa = 11.84RR66 pKa = 11.84SPLVVKK72 pKa = 10.41PRR74 pKa = 11.84DD75 pKa = 3.75TEE77 pKa = 4.09NLDD80 pKa = 3.31EE81 pKa = 4.48STTDD85 pKa = 3.27STVTSTDD92 pKa = 2.88ASSASTTDD100 pKa = 2.77SDD102 pKa = 4.0VTSDD106 pKa = 3.35STIASTEE113 pKa = 4.04SSSATDD119 pKa = 3.14SSTDD123 pKa = 3.06SSTNPQTVGSTEE135 pKa = 4.07SSTDD139 pKa = 2.8SSTISSTDD147 pKa = 2.82SSTATTDD154 pKa = 3.52DD155 pKa = 3.96SSTSDD160 pKa = 3.27STEE163 pKa = 3.6SSTTSEE169 pKa = 4.82PGSSSPSTTASTTDD183 pKa = 3.23STSEE187 pKa = 4.02STTDD191 pKa = 3.01STTDD195 pKa = 2.97STTDD199 pKa = 2.97STTDD203 pKa = 2.97STTDD207 pKa = 2.97STTDD211 pKa = 2.94STTDD215 pKa = 3.22STSDD219 pKa = 3.18STTDD223 pKa = 3.25STSDD227 pKa = 3.19STTDD231 pKa = 2.96STTDD235 pKa = 3.08STSQSTSSSTSSSTSDD251 pKa = 2.97STTDD255 pKa = 3.21STPNSSPVTTISPPISYY272 pKa = 10.47KK273 pKa = 10.63LAACYY278 pKa = 10.22SIYY281 pKa = 10.6KK282 pKa = 10.1EE283 pKa = 4.07GEE285 pKa = 4.01LYY287 pKa = 10.41RR288 pKa = 11.84GCIKK292 pKa = 10.76VPTNEE297 pKa = 4.32SACEE301 pKa = 3.7AVKK304 pKa = 10.81DD305 pKa = 3.83KK306 pKa = 11.88LEE308 pKa = 4.03ITEE311 pKa = 5.37DD312 pKa = 3.75SADD315 pKa = 3.4QCDD318 pKa = 3.05ICLTDD323 pKa = 3.55KK324 pKa = 11.48CNGSTSLQVSLGAMILLLAMGLKK347 pKa = 10.41NLFF350 pKa = 3.81
Molecular weight: 36.17 kDa
Isoelectric point according different methods:
Protein with the highest isoelectric point:
>tr|A0A6P4FLZ7|A0A6P4FLZ7_DRORH cilia- and flagella-associated protein 20 OS=Drosophila rhopaloa OX=1041015 GN=LOC108052803 PE=4 SV=1
MM1 pKa = 7.62AAHH4 pKa = 6.95KK5 pKa = 10.42SFRR8 pKa = 11.84IKK10 pKa = 10.51QKK12 pKa = 10.12LAKK15 pKa = 9.77KK16 pKa = 9.79LKK18 pKa = 9.05QNRR21 pKa = 11.84SVPQWVRR28 pKa = 11.84LRR30 pKa = 11.84TGNTIRR36 pKa = 11.84YY37 pKa = 5.79NAKK40 pKa = 8.47RR41 pKa = 11.84RR42 pKa = 11.84HH43 pKa = 4.1WRR45 pKa = 11.84RR46 pKa = 11.84TKK48 pKa = 10.89LKK50 pKa = 10.55LL51 pKa = 3.39
MM1 pKa = 7.62AAHH4 pKa = 6.95KK5 pKa = 10.42SFRR8 pKa = 11.84IKK10 pKa = 10.51QKK12 pKa = 10.12LAKK15 pKa = 9.77KK16 pKa = 9.79LKK18 pKa = 9.05QNRR21 pKa = 11.84SVPQWVRR28 pKa = 11.84LRR30 pKa = 11.84TGNTIRR36 pKa = 11.84YY37 pKa = 5.79NAKK40 pKa = 8.47RR41 pKa = 11.84RR42 pKa = 11.84HH43 pKa = 4.1WRR45 pKa = 11.84RR46 pKa = 11.84TKK48 pKa = 10.89LKK50 pKa = 10.55LL51 pKa = 3.39
Molecular weight: 6.3 kDa
Isoelectric point according different methods:
Peptides (in silico digests for buttom-up proteomics)
Below you can find in silico digests of the whole proteome with Trypsin, Chymotrypsin, Trypsin+LysC, LysN, ArgC proteases suitable for different mass spec machines.| Try ESI |
 |
|---|
| ChTry ESI |
 |
|---|
| ArgC ESI |
 |
|---|
| LysN ESI |
 |
|---|
| TryLysC ESI |
 |
|---|
| Try MALDI |
 |
|---|
| ChTry MALDI |
 |
|---|
| ArgC MALDI |
 |
|---|
| LysN MALDI |
 |
|---|
| TryLysC MALDI |
 |
|---|
| Try LTQ |
 |
|---|
| ChTry LTQ |
 |
|---|
| ArgC LTQ |
 |
|---|
| LysN LTQ |
 |
|---|
| TryLysC LTQ |
 |
|---|
| Try MSlow |
 |
|---|
| ChTry MSlow |
 |
|---|
| ArgC MSlow |
 |
|---|
| LysN MSlow |
 |
|---|
| TryLysC MSlow |
 |
|---|
| Try MShigh |
 |
|---|
| ChTry MShigh |
 |
|---|
| ArgC MShigh |
 |
|---|
| LysN MShigh |
 |
|---|
| TryLysC MShigh |
 |
|---|
General Statistics
Number of major isoforms |
Number of additional isoforms |
Number of all proteins |
Number of amino acids |
Min. Seq. Length |
Max. Seq. Length |
Avg. Seq. Length |
Avg. Mol. Weight |
|---|---|---|---|---|---|---|---|
13421361 |
32 |
21286 |
636.4 |
70.77 |
Amino acid frequency
Ala |
Cys |
Asp |
Glu |
Phe |
Gly |
His |
Ile |
Lys |
Leu |
|---|---|---|---|---|---|---|---|---|---|
7.353 ± 0.022 | 2.055 ± 0.073 |
5.242 ± 0.015 | 6.534 ± 0.024 |
3.374 ± 0.016 | 6.254 ± 0.023 |
2.612 ± 0.012 | 4.815 ± 0.016 |
5.487 ± 0.025 | 8.887 ± 0.038 |
Met |
Asn |
Gln |
Pro |
Arg |
Ser |
Thr |
Val |
Trp |
Tyr |
|---|---|---|---|---|---|---|---|---|---|
2.215 ± 0.013 | 4.732 ± 0.017 |
5.763 ± 0.037 | 5.404 ± 0.027 |
5.53 ± 0.017 | 8.416 ± 0.03 |
5.705 ± 0.02 | 5.867 ± 0.012 |
0.942 ± 0.007 | 2.806 ± 0.013 |
Most of the basic statistics you can see at this page can be downloaded from this CSV file
Proteome-pI is available under Creative Commons Attribution-NoDerivs license, for more details see here
| Reference: Kozlowski LP. Proteome-pI 2.0: Proteome Isoelectric Point Database Update. Nucleic Acids Res. 2021, doi: 10.1093/nar/gkab944 | Contact: Lukasz P. Kozlowski |
