Roseburia inulinivorans CAG:15
Taxonomy: cellular organisms; Bacteria; Terrabacteria group; Firmicutes; Clostridia; Eubacteriales; Lachnospiraceae; Roseburia; environmental samples
Average proteome isoelectric point is 5.88
Get precalculated fractions of proteins

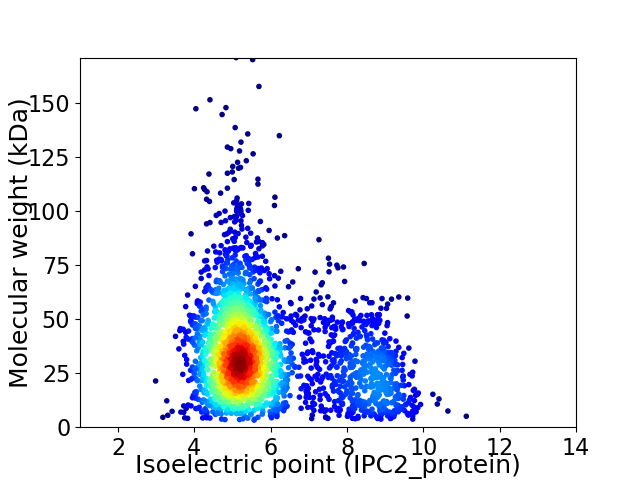
Virtual 2D-PAGE plot for 2653 proteins (isoelectric point calculated using IPC2_protein)
Get csv file with sequences according to given criteria:
* You can choose from 21 different methods for calculating isoelectric point
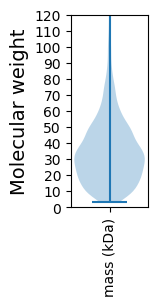
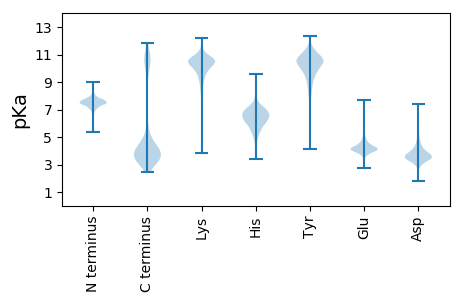
Summary statistics related to proteome-wise predictions


Protein with the lowest isoelectric point:
>tr|R5HHW5|R5HHW5_9FIRM Signal transduction histidine kinase LytS OS=Roseburia inulinivorans CAG:15 OX=1263105 GN=BN501_01321 PE=4 SV=1
MM1 pKa = 7.29KK2 pKa = 10.14KK3 pKa = 10.19KK4 pKa = 10.13VVSVILAMTMVASMAMGCGSGSDD27 pKa = 3.45TTTSDD32 pKa = 2.85NSTTTTTNDD41 pKa = 3.01AAASTEE47 pKa = 3.97ASDD50 pKa = 5.21AADD53 pKa = 3.61ATADD57 pKa = 3.63AANGDD62 pKa = 4.02LADD65 pKa = 4.42KK66 pKa = 10.79KK67 pKa = 11.16VGVCIYY73 pKa = 10.52QFADD77 pKa = 2.77NFMTLFRR84 pKa = 11.84GEE86 pKa = 4.23LEE88 pKa = 4.23NYY90 pKa = 9.72LVEE93 pKa = 4.63QGFSKK98 pKa = 11.16DD99 pKa = 3.2NITIVDD105 pKa = 4.16GANDD109 pKa = 3.29QATQTNQIQNFITQGVDD126 pKa = 3.06VLIINPVNSSSAEE139 pKa = 4.16TITDD143 pKa = 3.53MVVEE147 pKa = 4.27AGIPLVYY154 pKa = 10.23INRR157 pKa = 11.84EE158 pKa = 3.56PDD160 pKa = 2.96ASEE163 pKa = 3.85EE164 pKa = 4.49QRR166 pKa = 11.84WADD169 pKa = 3.68NNWDD173 pKa = 3.61VTYY176 pKa = 10.37VGCDD180 pKa = 2.96ARR182 pKa = 11.84QSGTYY187 pKa = 8.18QGEE190 pKa = 4.29MIADD194 pKa = 4.54LGLDD198 pKa = 3.47TVDD201 pKa = 3.35MNGNGKK207 pKa = 8.9IDD209 pKa = 3.93YY210 pKa = 10.73IMIEE214 pKa = 4.19GDD216 pKa = 3.83PEE218 pKa = 4.26NVDD221 pKa = 2.89AQYY224 pKa = 9.38RR225 pKa = 11.84TEE227 pKa = 3.99YY228 pKa = 10.35SIKK231 pKa = 10.34ALEE234 pKa = 4.37DD235 pKa = 3.12AGLEE239 pKa = 4.37VNCLDD244 pKa = 4.58DD245 pKa = 5.14QVGMWDD251 pKa = 3.26QATAQQLVANSLSQNGNDD269 pKa = 3.57IEE271 pKa = 5.43VVFCNNDD278 pKa = 2.86AMALGALQAIEE289 pKa = 4.22SAGRR293 pKa = 11.84TVGEE297 pKa = 4.54DD298 pKa = 2.93IYY300 pKa = 11.44LVGVDD305 pKa = 4.29ALSEE309 pKa = 4.0ALEE312 pKa = 4.43DD313 pKa = 3.83VLAGTMTGTVFNDD326 pKa = 3.53HH327 pKa = 7.14FSQSHH332 pKa = 5.07SAADD336 pKa = 3.36AAINYY341 pKa = 9.67LSGAGNEE348 pKa = 4.46HH349 pKa = 7.15YY350 pKa = 10.38IGCDD354 pKa = 3.34YY355 pKa = 11.75VKK357 pKa = 9.82VTKK360 pKa = 10.81DD361 pKa = 3.05NAQEE365 pKa = 3.74ILDD368 pKa = 3.88MVKK371 pKa = 10.74
MM1 pKa = 7.29KK2 pKa = 10.14KK3 pKa = 10.19KK4 pKa = 10.13VVSVILAMTMVASMAMGCGSGSDD27 pKa = 3.45TTTSDD32 pKa = 2.85NSTTTTTNDD41 pKa = 3.01AAASTEE47 pKa = 3.97ASDD50 pKa = 5.21AADD53 pKa = 3.61ATADD57 pKa = 3.63AANGDD62 pKa = 4.02LADD65 pKa = 4.42KK66 pKa = 10.79KK67 pKa = 11.16VGVCIYY73 pKa = 10.52QFADD77 pKa = 2.77NFMTLFRR84 pKa = 11.84GEE86 pKa = 4.23LEE88 pKa = 4.23NYY90 pKa = 9.72LVEE93 pKa = 4.63QGFSKK98 pKa = 11.16DD99 pKa = 3.2NITIVDD105 pKa = 4.16GANDD109 pKa = 3.29QATQTNQIQNFITQGVDD126 pKa = 3.06VLIINPVNSSSAEE139 pKa = 4.16TITDD143 pKa = 3.53MVVEE147 pKa = 4.27AGIPLVYY154 pKa = 10.23INRR157 pKa = 11.84EE158 pKa = 3.56PDD160 pKa = 2.96ASEE163 pKa = 3.85EE164 pKa = 4.49QRR166 pKa = 11.84WADD169 pKa = 3.68NNWDD173 pKa = 3.61VTYY176 pKa = 10.37VGCDD180 pKa = 2.96ARR182 pKa = 11.84QSGTYY187 pKa = 8.18QGEE190 pKa = 4.29MIADD194 pKa = 4.54LGLDD198 pKa = 3.47TVDD201 pKa = 3.35MNGNGKK207 pKa = 8.9IDD209 pKa = 3.93YY210 pKa = 10.73IMIEE214 pKa = 4.19GDD216 pKa = 3.83PEE218 pKa = 4.26NVDD221 pKa = 2.89AQYY224 pKa = 9.38RR225 pKa = 11.84TEE227 pKa = 3.99YY228 pKa = 10.35SIKK231 pKa = 10.34ALEE234 pKa = 4.37DD235 pKa = 3.12AGLEE239 pKa = 4.37VNCLDD244 pKa = 4.58DD245 pKa = 5.14QVGMWDD251 pKa = 3.26QATAQQLVANSLSQNGNDD269 pKa = 3.57IEE271 pKa = 5.43VVFCNNDD278 pKa = 2.86AMALGALQAIEE289 pKa = 4.22SAGRR293 pKa = 11.84TVGEE297 pKa = 4.54DD298 pKa = 2.93IYY300 pKa = 11.44LVGVDD305 pKa = 4.29ALSEE309 pKa = 4.0ALEE312 pKa = 4.43DD313 pKa = 3.83VLAGTMTGTVFNDD326 pKa = 3.53HH327 pKa = 7.14FSQSHH332 pKa = 5.07SAADD336 pKa = 3.36AAINYY341 pKa = 9.67LSGAGNEE348 pKa = 4.46HH349 pKa = 7.15YY350 pKa = 10.38IGCDD354 pKa = 3.34YY355 pKa = 11.75VKK357 pKa = 9.82VTKK360 pKa = 10.81DD361 pKa = 3.05NAQEE365 pKa = 3.74ILDD368 pKa = 3.88MVKK371 pKa = 10.74
Molecular weight: 39.64 kDa
Isoelectric point according different methods:
Protein with the highest isoelectric point:
>tr|R5I3G0|R5I3G0_9FIRM Uncharacterized protein OS=Roseburia inulinivorans CAG:15 OX=1263105 GN=BN501_00873 PE=3 SV=1
MM1 pKa = 7.67KK2 pKa = 8.72MTFQPKK8 pKa = 8.79KK9 pKa = 7.6RR10 pKa = 11.84QRR12 pKa = 11.84AKK14 pKa = 9.2VHH16 pKa = 5.65GFRR19 pKa = 11.84SRR21 pKa = 11.84MSTAGGRR28 pKa = 11.84KK29 pKa = 8.62VLAARR34 pKa = 11.84RR35 pKa = 11.84LKK37 pKa = 10.61GRR39 pKa = 11.84KK40 pKa = 8.87KK41 pKa = 10.59LSAA44 pKa = 3.95
MM1 pKa = 7.67KK2 pKa = 8.72MTFQPKK8 pKa = 8.79KK9 pKa = 7.6RR10 pKa = 11.84QRR12 pKa = 11.84AKK14 pKa = 9.2VHH16 pKa = 5.65GFRR19 pKa = 11.84SRR21 pKa = 11.84MSTAGGRR28 pKa = 11.84KK29 pKa = 8.62VLAARR34 pKa = 11.84RR35 pKa = 11.84LKK37 pKa = 10.61GRR39 pKa = 11.84KK40 pKa = 8.87KK41 pKa = 10.59LSAA44 pKa = 3.95
Molecular weight: 5.06 kDa
Isoelectric point according different methods:
Peptides (in silico digests for buttom-up proteomics)
Below you can find in silico digests of the whole proteome with Trypsin, Chymotrypsin, Trypsin+LysC, LysN, ArgC proteases suitable for different mass spec machines.| Try ESI |
 |
|---|
| ChTry ESI |
 |
|---|
| ArgC ESI |
 |
|---|
| LysN ESI |
 |
|---|
| TryLysC ESI |
 |
|---|
| Try MALDI |
 |
|---|
| ChTry MALDI |
 |
|---|
| ArgC MALDI |
 |
|---|
| LysN MALDI |
 |
|---|
| TryLysC MALDI |
 |
|---|
| Try LTQ |
 |
|---|
| ChTry LTQ |
 |
|---|
| ArgC LTQ |
 |
|---|
| LysN LTQ |
 |
|---|
| TryLysC LTQ |
 |
|---|
| Try MSlow |
 |
|---|
| ChTry MSlow |
 |
|---|
| ArgC MSlow |
 |
|---|
| LysN MSlow |
 |
|---|
| TryLysC MSlow |
 |
|---|
| Try MShigh |
 |
|---|
| ChTry MShigh |
 |
|---|
| ArgC MShigh |
 |
|---|
| LysN MShigh |
 |
|---|
| TryLysC MShigh |
 |
|---|
General Statistics
Number of major isoforms |
Number of additional isoforms |
Number of all proteins |
Number of amino acids |
Min. Seq. Length |
Max. Seq. Length |
Avg. Seq. Length |
Avg. Mol. Weight |
|---|---|---|---|---|---|---|---|
0 |
844942 |
29 |
1532 |
318.5 |
35.81 |
Amino acid frequency
Ala |
Cys |
Asp |
Glu |
Phe |
Gly |
His |
Ile |
Lys |
Leu |
|---|---|---|---|---|---|---|---|---|---|
7.461 ± 0.049 | 1.443 ± 0.018 |
5.761 ± 0.04 | 7.864 ± 0.055 |
4.206 ± 0.035 | 6.728 ± 0.04 |
1.769 ± 0.025 | 7.571 ± 0.043 |
6.996 ± 0.044 | 8.731 ± 0.05 |
Met |
Asn |
Gln |
Pro |
Arg |
Ser |
Thr |
Val |
Trp |
Tyr |
|---|---|---|---|---|---|---|---|---|---|
3.265 ± 0.023 | 4.647 ± 0.036 |
3.019 ± 0.023 | 3.315 ± 0.029 |
3.927 ± 0.036 | 5.594 ± 0.037 |
5.524 ± 0.042 | 6.985 ± 0.039 |
0.86 ± 0.014 | 4.33 ± 0.034 |
Most of the basic statistics you can see at this page can be downloaded from this CSV file
Proteome-pI is available under Creative Commons Attribution-NoDerivs license, for more details see here
| Reference: Kozlowski LP. Proteome-pI 2.0: Proteome Isoelectric Point Database Update. Nucleic Acids Res. 2021, doi: 10.1093/nar/gkab944 | Contact: Lukasz P. Kozlowski |
