Microvirus sp.
Taxonomy: Viruses; Monodnaviria; Sangervirae; Phixviricota; Malgrandaviricetes; Petitvirales; Microviridae; unclassified Microviridae
Average proteome isoelectric point is 7.32
Get precalculated fractions of proteins

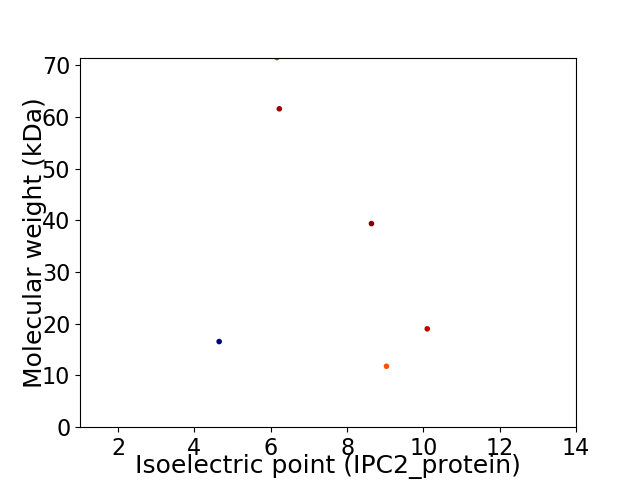
Virtual 2D-PAGE plot for 6 proteins (isoelectric point calculated using IPC2_protein)
Get csv file with sequences according to given criteria:
* You can choose from 21 different methods for calculating isoelectric point
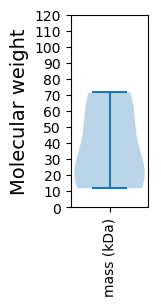
Summary statistics related to proteome-wise predictions


Protein with the lowest isoelectric point:
>tr|A0A2Z4GUJ1|A0A2Z4GUJ1_9VIRU Uncharacterized protein OS=Microvirus sp. OX=2202559 PE=4 SV=1
MM1 pKa = 7.25FANEE5 pKa = 4.29FLTYY9 pKa = 9.99IPPIGEE15 pKa = 4.48DD16 pKa = 3.4LQHH19 pKa = 6.67TIVSDD24 pKa = 3.96DD25 pKa = 3.56CTKK28 pKa = 10.67LHH30 pKa = 6.6SDD32 pKa = 3.78IYY34 pKa = 9.74LLHH37 pKa = 7.23HH38 pKa = 6.59IGEE41 pKa = 4.86LNVSNNLADD50 pKa = 5.62AITSRR55 pKa = 11.84LQSVSDD61 pKa = 3.94SMPDD65 pKa = 3.56DD66 pKa = 4.01LRR68 pKa = 11.84QSFDD72 pKa = 3.54KK73 pKa = 11.29LDD75 pKa = 4.09DD76 pKa = 3.91FEE78 pKa = 6.35KK79 pKa = 10.71MEE81 pKa = 4.39VTDD84 pKa = 3.37SRR86 pKa = 11.84YY87 pKa = 10.19AQWVSDD93 pKa = 3.43KK94 pKa = 11.01VSRR97 pKa = 11.84TKK99 pKa = 10.93QFMKK103 pKa = 10.77DD104 pKa = 2.7FDD106 pKa = 4.25TAVSKK111 pKa = 11.29LKK113 pKa = 9.75DD114 pKa = 3.46TEE116 pKa = 4.17EE117 pKa = 4.13SQKK120 pKa = 11.14LKK122 pKa = 10.62AAQKK126 pKa = 10.01NLRR129 pKa = 11.84DD130 pKa = 4.34FILRR134 pKa = 11.84LGSDD138 pKa = 4.87DD139 pKa = 5.21IPDD142 pKa = 3.69KK143 pKa = 10.91EE144 pKa = 4.09
MM1 pKa = 7.25FANEE5 pKa = 4.29FLTYY9 pKa = 9.99IPPIGEE15 pKa = 4.48DD16 pKa = 3.4LQHH19 pKa = 6.67TIVSDD24 pKa = 3.96DD25 pKa = 3.56CTKK28 pKa = 10.67LHH30 pKa = 6.6SDD32 pKa = 3.78IYY34 pKa = 9.74LLHH37 pKa = 7.23HH38 pKa = 6.59IGEE41 pKa = 4.86LNVSNNLADD50 pKa = 5.62AITSRR55 pKa = 11.84LQSVSDD61 pKa = 3.94SMPDD65 pKa = 3.56DD66 pKa = 4.01LRR68 pKa = 11.84QSFDD72 pKa = 3.54KK73 pKa = 11.29LDD75 pKa = 4.09DD76 pKa = 3.91FEE78 pKa = 6.35KK79 pKa = 10.71MEE81 pKa = 4.39VTDD84 pKa = 3.37SRR86 pKa = 11.84YY87 pKa = 10.19AQWVSDD93 pKa = 3.43KK94 pKa = 11.01VSRR97 pKa = 11.84TKK99 pKa = 10.93QFMKK103 pKa = 10.77DD104 pKa = 2.7FDD106 pKa = 4.25TAVSKK111 pKa = 11.29LKK113 pKa = 9.75DD114 pKa = 3.46TEE116 pKa = 4.17EE117 pKa = 4.13SQKK120 pKa = 11.14LKK122 pKa = 10.62AAQKK126 pKa = 10.01NLRR129 pKa = 11.84DD130 pKa = 4.34FILRR134 pKa = 11.84LGSDD138 pKa = 4.87DD139 pKa = 5.21IPDD142 pKa = 3.69KK143 pKa = 10.91EE144 pKa = 4.09
Molecular weight: 16.56 kDa
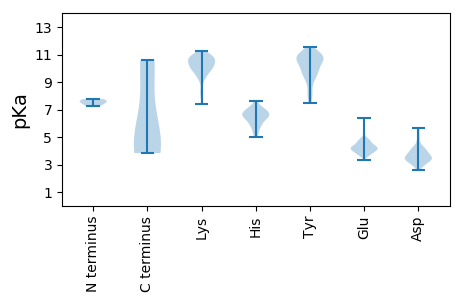
Isoelectric point according different methods:
Protein with the highest isoelectric point:
>tr|A0A2Z4GUP5|A0A2Z4GUP5_9VIRU Uncharacterized protein OS=Microvirus sp. OX=2202559 PE=4 SV=1
MM1 pKa = 7.39LLSFKK6 pKa = 10.37IHH8 pKa = 5.96LQVLSLLITIKK19 pKa = 10.28WLVLLMFNVRR29 pKa = 11.84LNKK32 pKa = 9.98PILIGYY38 pKa = 7.44LAKK41 pKa = 10.61SKK43 pKa = 10.77LVLLLLYY50 pKa = 10.51RR51 pKa = 11.84MYY53 pKa = 11.04VPWFLRR59 pKa = 11.84CILIMLKK66 pKa = 10.62LKK68 pKa = 9.55TLMLWLRR75 pKa = 11.84LIMLKK80 pKa = 10.57KK81 pKa = 10.1LVCVLIISCKK91 pKa = 9.75ILFLICLLVWLKK103 pKa = 10.71ISILKK108 pKa = 10.45VMLNKK113 pKa = 10.01TNGVVVLTFLYY124 pKa = 10.97LSMLLPLLLRR134 pKa = 11.84SLHH137 pKa = 6.44LLLNLVGKK145 pKa = 9.68QKK147 pKa = 10.94NIRR150 pKa = 11.84NNNIIFYY157 pKa = 8.43YY158 pKa = 10.14TLLL161 pKa = 4.91
MM1 pKa = 7.39LLSFKK6 pKa = 10.37IHH8 pKa = 5.96LQVLSLLITIKK19 pKa = 10.28WLVLLMFNVRR29 pKa = 11.84LNKK32 pKa = 9.98PILIGYY38 pKa = 7.44LAKK41 pKa = 10.61SKK43 pKa = 10.77LVLLLLYY50 pKa = 10.51RR51 pKa = 11.84MYY53 pKa = 11.04VPWFLRR59 pKa = 11.84CILIMLKK66 pKa = 10.62LKK68 pKa = 9.55TLMLWLRR75 pKa = 11.84LIMLKK80 pKa = 10.57KK81 pKa = 10.1LVCVLIISCKK91 pKa = 9.75ILFLICLLVWLKK103 pKa = 10.71ISILKK108 pKa = 10.45VMLNKK113 pKa = 10.01TNGVVVLTFLYY124 pKa = 10.97LSMLLPLLLRR134 pKa = 11.84SLHH137 pKa = 6.44LLLNLVGKK145 pKa = 9.68QKK147 pKa = 10.94NIRR150 pKa = 11.84NNNIIFYY157 pKa = 8.43YY158 pKa = 10.14TLLL161 pKa = 4.91
Molecular weight: 19.02 kDa
Isoelectric point according different methods:
Peptides (in silico digests for buttom-up proteomics)
Below you can find in silico digests of the whole proteome with Trypsin, Chymotrypsin, Trypsin+LysC, LysN, ArgC proteases suitable for different mass spec machines.| Try ESI |
 |
|---|
| ChTry ESI |
 |
|---|
| ArgC ESI |
 |
|---|
| LysN ESI |
 |
|---|
| TryLysC ESI |
 |
|---|
| Try MALDI |
 |
|---|
| ChTry MALDI |
 |
|---|
| ArgC MALDI |
 |
|---|
| LysN MALDI |
 |
|---|
| TryLysC MALDI |
 |
|---|
| Try LTQ |
 |
|---|
| ChTry LTQ |
 |
|---|
| ArgC LTQ |
 |
|---|
| LysN LTQ |
 |
|---|
| TryLysC LTQ |
 |
|---|
| Try MSlow |
 |
|---|
| ChTry MSlow |
 |
|---|
| ArgC MSlow |
 |
|---|
| LysN MSlow |
 |
|---|
| TryLysC MSlow |
 |
|---|
| Try MShigh |
 |
|---|
| ChTry MShigh |
 |
|---|
| ArgC MShigh |
 |
|---|
| LysN MShigh |
 |
|---|
| TryLysC MShigh |
 |
|---|
General Statistics
Number of major isoforms |
Number of additional isoforms |
Number of all proteins |
Number of amino acids |
Min. Seq. Length |
Max. Seq. Length |
Avg. Seq. Length |
Avg. Mol. Weight |
|---|---|---|---|---|---|---|---|
0 |
1922 |
102 |
640 |
320.3 |
36.63 |
Amino acid frequency
Ala |
Cys |
Asp |
Glu |
Phe |
Gly |
His |
Ile |
Lys |
Leu |
|---|---|---|---|---|---|---|---|---|---|
6.66 ± 1.794 | 1.925 ± 0.589 |
5.671 ± 0.864 | 3.954 ± 0.791 |
5.463 ± 0.919 | 4.318 ± 0.843 |
2.393 ± 0.601 | 5.307 ± 0.74 |
5.723 ± 0.765 | 10.822 ± 2.407 |
Met |
Asn |
Gln |
Pro |
Arg |
Ser |
Thr |
Val |
Trp |
Tyr |
|---|---|---|---|---|---|---|---|---|---|
2.341 ± 0.515 | 5.931 ± 0.911 |
3.85 ± 0.442 | 4.527 ± 1.205 |
5.047 ± 0.627 | 9.781 ± 0.761 |
4.475 ± 0.43 | 5.151 ± 0.594 |
1.301 ± 0.264 | 5.359 ± 0.921 |
Most of the basic statistics you can see at this page can be downloaded from this CSV file
Proteome-pI is available under Creative Commons Attribution-NoDerivs license, for more details see here
| Reference: Kozlowski LP. Proteome-pI 2.0: Proteome Isoelectric Point Database Update. Nucleic Acids Res. 2021, doi: 10.1093/nar/gkab944 | Contact: Lukasz P. Kozlowski |
