African cassava mosaic Burkina Faso virus
Taxonomy: Viruses; Monodnaviria; Shotokuvirae; Cressdnaviricota; Repensiviricetes; Geplafuvirales; Geminiviridae; Begomovirus
Average proteome isoelectric point is 7.38
Get precalculated fractions of proteins

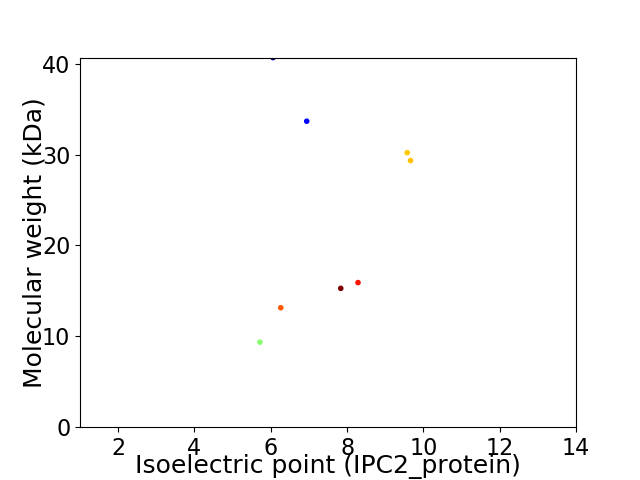
Virtual 2D-PAGE plot for 8 proteins (isoelectric point calculated using IPC2_protein)
Get csv file with sequences according to given criteria:
* You can choose from 21 different methods for calculating isoelectric point
Summary statistics related to proteome-wise predictions


Protein with the lowest isoelectric point:
>tr|H8WR14|H8WR14_9GEMI Isoform of H8WR17 Protein V2 OS=African cassava mosaic Burkina Faso virus OX=2560285 GN=AV2 PE=3 SV=1
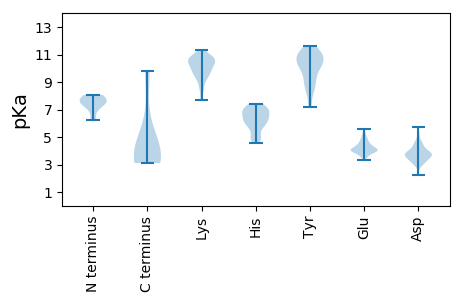
MM1 pKa = 7.55GSLISMCLFSSKK13 pKa = 10.86EE14 pKa = 3.71NTTAKK19 pKa = 10.49INDD22 pKa = 3.29SSTWYY27 pKa = 8.14PQPGQHH33 pKa = 6.88ISIQTFKK40 pKa = 10.68EE41 pKa = 3.94LNQAPMSSPTSTRR54 pKa = 11.84TEE56 pKa = 3.96TPLNGEE62 pKa = 4.09NSRR65 pKa = 11.84STEE68 pKa = 3.95EE69 pKa = 4.07VLGEE73 pKa = 4.01AARR76 pKa = 11.84TLTTLQQRR84 pKa = 11.84PP85 pKa = 3.55
MM1 pKa = 7.55GSLISMCLFSSKK13 pKa = 10.86EE14 pKa = 3.71NTTAKK19 pKa = 10.49INDD22 pKa = 3.29SSTWYY27 pKa = 8.14PQPGQHH33 pKa = 6.88ISIQTFKK40 pKa = 10.68EE41 pKa = 3.94LNQAPMSSPTSTRR54 pKa = 11.84TEE56 pKa = 3.96TPLNGEE62 pKa = 4.09NSRR65 pKa = 11.84STEE68 pKa = 3.95EE69 pKa = 4.07VLGEE73 pKa = 4.01AARR76 pKa = 11.84TLTTLQQRR84 pKa = 11.84PP85 pKa = 3.55
Molecular weight: 9.36 kDa
Isoelectric point according different methods:
Protein with the highest isoelectric point:
>tr|H8WR35|H8WR35_9GEMI Isoform of H8WR18 Capsid protein OS=African cassava mosaic Burkina Faso virus OX=2560285 GN=AV1 PE=3 SV=1
MM1 pKa = 7.7SKK3 pKa = 10.44RR4 pKa = 11.84PGDD7 pKa = 3.93IIISTPGSKK16 pKa = 9.66VRR18 pKa = 11.84RR19 pKa = 11.84RR20 pKa = 11.84LNFDD24 pKa = 3.03SPYY27 pKa = 10.29RR28 pKa = 11.84NRR30 pKa = 11.84ATAPTVHH37 pKa = 4.8VTNRR41 pKa = 11.84KK42 pKa = 7.72RR43 pKa = 11.84AWMNRR48 pKa = 11.84PMYY51 pKa = 9.16RR52 pKa = 11.84KK53 pKa = 8.85PMMYY57 pKa = 10.13RR58 pKa = 11.84MYY60 pKa = 10.28RR61 pKa = 11.84SPDD64 pKa = 2.95IPRR67 pKa = 11.84GCEE70 pKa = 4.19GPCKK74 pKa = 10.21VQSFEE79 pKa = 3.87QRR81 pKa = 11.84DD82 pKa = 3.95DD83 pKa = 3.77VKK85 pKa = 11.15HH86 pKa = 6.56LGICKK91 pKa = 10.03VISDD95 pKa = 3.77VTRR98 pKa = 11.84GPGLTHH104 pKa = 6.87RR105 pKa = 11.84VGKK108 pKa = 9.86RR109 pKa = 11.84FCIKK113 pKa = 10.26SIYY116 pKa = 9.81ILGKK120 pKa = 9.09IWMDD124 pKa = 3.64EE125 pKa = 4.09NIKK128 pKa = 10.08KK129 pKa = 9.99QNHH132 pKa = 4.98TNNVMFYY139 pKa = 10.26LLRR142 pKa = 11.84DD143 pKa = 3.45RR144 pKa = 11.84RR145 pKa = 11.84PYY147 pKa = 11.37GNTPQDD153 pKa = 3.26FGQIFNMFDD162 pKa = 3.66NEE164 pKa = 4.15PSTATIKK171 pKa = 10.92NDD173 pKa = 2.93LRR175 pKa = 11.84DD176 pKa = 3.48RR177 pKa = 11.84FQVLRR182 pKa = 11.84KK183 pKa = 8.78FHH185 pKa = 6.12ATVIGGPSGMKK196 pKa = 9.5EE197 pKa = 3.54QALVKK202 pKa = 10.21RR203 pKa = 11.84FYY205 pKa = 10.9RR206 pKa = 11.84LNHH209 pKa = 5.75HH210 pKa = 5.51VTYY213 pKa = 10.8NHH215 pKa = 6.01QEE217 pKa = 3.51AGKK220 pKa = 10.41YY221 pKa = 8.39EE222 pKa = 4.09NHH224 pKa = 6.52TEE226 pKa = 3.99NALLLYY232 pKa = 7.29MACTHH237 pKa = 7.07ASNPVYY243 pKa = 9.86ATLKK247 pKa = 9.47IRR249 pKa = 11.84IYY251 pKa = 10.63FYY253 pKa = 11.33DD254 pKa = 3.78SIGNN258 pKa = 3.69
MM1 pKa = 7.7SKK3 pKa = 10.44RR4 pKa = 11.84PGDD7 pKa = 3.93IIISTPGSKK16 pKa = 9.66VRR18 pKa = 11.84RR19 pKa = 11.84RR20 pKa = 11.84LNFDD24 pKa = 3.03SPYY27 pKa = 10.29RR28 pKa = 11.84NRR30 pKa = 11.84ATAPTVHH37 pKa = 4.8VTNRR41 pKa = 11.84KK42 pKa = 7.72RR43 pKa = 11.84AWMNRR48 pKa = 11.84PMYY51 pKa = 9.16RR52 pKa = 11.84KK53 pKa = 8.85PMMYY57 pKa = 10.13RR58 pKa = 11.84MYY60 pKa = 10.28RR61 pKa = 11.84SPDD64 pKa = 2.95IPRR67 pKa = 11.84GCEE70 pKa = 4.19GPCKK74 pKa = 10.21VQSFEE79 pKa = 3.87QRR81 pKa = 11.84DD82 pKa = 3.95DD83 pKa = 3.77VKK85 pKa = 11.15HH86 pKa = 6.56LGICKK91 pKa = 10.03VISDD95 pKa = 3.77VTRR98 pKa = 11.84GPGLTHH104 pKa = 6.87RR105 pKa = 11.84VGKK108 pKa = 9.86RR109 pKa = 11.84FCIKK113 pKa = 10.26SIYY116 pKa = 9.81ILGKK120 pKa = 9.09IWMDD124 pKa = 3.64EE125 pKa = 4.09NIKK128 pKa = 10.08KK129 pKa = 9.99QNHH132 pKa = 4.98TNNVMFYY139 pKa = 10.26LLRR142 pKa = 11.84DD143 pKa = 3.45RR144 pKa = 11.84RR145 pKa = 11.84PYY147 pKa = 11.37GNTPQDD153 pKa = 3.26FGQIFNMFDD162 pKa = 3.66NEE164 pKa = 4.15PSTATIKK171 pKa = 10.92NDD173 pKa = 2.93LRR175 pKa = 11.84DD176 pKa = 3.48RR177 pKa = 11.84FQVLRR182 pKa = 11.84KK183 pKa = 8.78FHH185 pKa = 6.12ATVIGGPSGMKK196 pKa = 9.5EE197 pKa = 3.54QALVKK202 pKa = 10.21RR203 pKa = 11.84FYY205 pKa = 10.9RR206 pKa = 11.84LNHH209 pKa = 5.75HH210 pKa = 5.51VTYY213 pKa = 10.8NHH215 pKa = 6.01QEE217 pKa = 3.51AGKK220 pKa = 10.41YY221 pKa = 8.39EE222 pKa = 4.09NHH224 pKa = 6.52TEE226 pKa = 3.99NALLLYY232 pKa = 7.29MACTHH237 pKa = 7.07ASNPVYY243 pKa = 9.86ATLKK247 pKa = 9.47IRR249 pKa = 11.84IYY251 pKa = 10.63FYY253 pKa = 11.33DD254 pKa = 3.78SIGNN258 pKa = 3.69
Molecular weight: 30.21 kDa
Isoelectric point according different methods:
Peptides (in silico digests for buttom-up proteomics)
Below you can find in silico digests of the whole proteome with Trypsin, Chymotrypsin, Trypsin+LysC, LysN, ArgC proteases suitable for different mass spec machines.| Try ESI |
 |
|---|
| ChTry ESI |
 |
|---|
| ArgC ESI |
 |
|---|
| LysN ESI |
 |
|---|
| TryLysC ESI |
 |
|---|
| Try MALDI |
 |
|---|
| ChTry MALDI |
 |
|---|
| ArgC MALDI |
 |
|---|
| LysN MALDI |
 |
|---|
| TryLysC MALDI |
 |
|---|
| Try LTQ |
 |
|---|
| ChTry LTQ |
 |
|---|
| ArgC LTQ |
 |
|---|
| LysN LTQ |
 |
|---|
| TryLysC LTQ |
 |
|---|
| Try MSlow |
 |
|---|
| ChTry MSlow |
 |
|---|
| ArgC MSlow |
 |
|---|
| LysN MSlow |
 |
|---|
| TryLysC MSlow |
 |
|---|
| Try MShigh |
 |
|---|
| ChTry MShigh |
 |
|---|
| ArgC MShigh |
 |
|---|
| LysN MShigh |
 |
|---|
| TryLysC MShigh |
 |
|---|
General Statistics
Number of major isoforms |
Number of additional isoforms |
Number of all proteins |
Number of amino acids |
Min. Seq. Length |
Max. Seq. Length |
Avg. Seq. Length |
Avg. Mol. Weight |
|---|---|---|---|---|---|---|---|
1638 |
85 |
359 |
204.8 |
23.45 |
Amino acid frequency
Ala |
Cys |
Asp |
Glu |
Phe |
Gly |
His |
Ile |
Lys |
Leu |
|---|---|---|---|---|---|---|---|---|---|
4.762 ± 0.706 | 1.77 ± 0.213 |
5.311 ± 0.7 | 4.64 ± 0.483 |
4.396 ± 0.334 | 5.25 ± 0.3 |
3.846 ± 0.534 | 6.166 ± 0.681 |
5.8 ± 0.728 | 6.716 ± 0.459 |
Met |
Asn |
Gln |
Pro |
Arg |
Ser |
Thr |
Val |
Trp |
Tyr |
|---|---|---|---|---|---|---|---|---|---|
2.259 ± 0.349 | 5.739 ± 0.751 |
5.739 ± 0.413 | 4.945 ± 0.34 |
6.716 ± 0.922 | 8.73 ± 1.088 |
6.166 ± 0.712 | 5.739 ± 1.0 |
1.16 ± 0.217 | 4.151 ± 0.425 |
Most of the basic statistics you can see at this page can be downloaded from this CSV file
Proteome-pI is available under Creative Commons Attribution-NoDerivs license, for more details see here
| Reference: Kozlowski LP. Proteome-pI 2.0: Proteome Isoelectric Point Database Update. Nucleic Acids Res. 2021, doi: 10.1093/nar/gkab944 | Contact: Lukasz P. Kozlowski |
