Thermoclostridium stercorarium (strain ATCC 35414 / DSM 8532 / NCIMB 11754) (Clostridium stercorarium)
Taxonomy: cellular organisms; Bacteria; Terrabacteria group; Firmicutes; Clostridia; Eubacteriales; Oscillospiraceae; Thermoclostridium; Thermoclostridium stercorarium; Thermoclostridium stercorarium subsp. stercorarium
Average proteome isoelectric point is 6.55
Get precalculated fractions of proteins

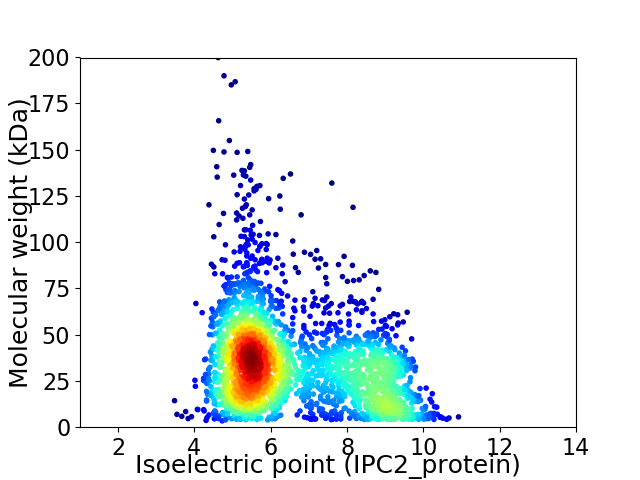
Virtual 2D-PAGE plot for 2669 proteins (isoelectric point calculated using IPC2_protein)
Get csv file with sequences according to given criteria:
* You can choose from 21 different methods for calculating isoelectric point
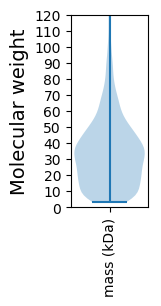
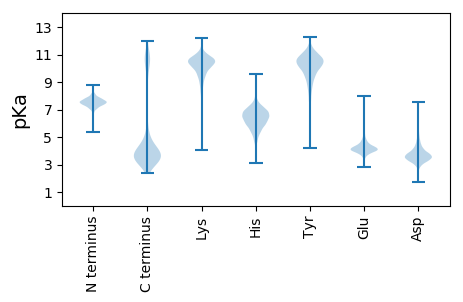
Summary statistics related to proteome-wise predictions


Protein with the lowest isoelectric point:
>tr|L7VTA6|L7VTA6_THES1 30S ribosomal protein S10 OS=Thermoclostridium stercorarium (strain ATCC 35414 / DSM 8532 / NCIMB 11754) OX=1121335 GN=rpsJ PE=3 SV=1
MM1 pKa = 7.71KK2 pKa = 10.32KK3 pKa = 10.35NKK5 pKa = 9.09TPFIIAAAVLIAVGIAVLVFINQGNGNEE33 pKa = 4.43NIGDD37 pKa = 3.89KK38 pKa = 10.69NVSSNADD45 pKa = 3.25EE46 pKa = 4.71NGDD49 pKa = 3.68VKK51 pKa = 10.97DD52 pKa = 3.84TGEE55 pKa = 4.01TGQNNGNIGEE65 pKa = 4.2RR66 pKa = 11.84KK67 pKa = 9.73GYY69 pKa = 8.09YY70 pKa = 9.42FEE72 pKa = 4.39YY73 pKa = 10.23KK74 pKa = 10.34GVEE77 pKa = 3.38IGINDD82 pKa = 3.49EE83 pKa = 3.89AAPIIEE89 pKa = 4.35ALGEE93 pKa = 3.81PMNYY97 pKa = 9.56FEE99 pKa = 5.75APSCAFEE106 pKa = 4.86GMDD109 pKa = 4.86KK110 pKa = 10.23IYY112 pKa = 10.44SYY114 pKa = 11.59SGFEE118 pKa = 3.74FTTYY122 pKa = 10.36TKK124 pKa = 10.61DD125 pKa = 3.2GKK127 pKa = 10.62DD128 pKa = 3.66YY129 pKa = 10.68IASLVFLDD137 pKa = 3.95DD138 pKa = 3.42TVTTRR143 pKa = 11.84EE144 pKa = 4.52GITLNATLDD153 pKa = 3.96DD154 pKa = 4.54VIATYY159 pKa = 10.71GSDD162 pKa = 3.58YY163 pKa = 10.45EE164 pKa = 4.27QSFSKK169 pKa = 10.88YY170 pKa = 10.0SYY172 pKa = 11.26SDD174 pKa = 3.72GNCVLSFIIEE184 pKa = 4.07NGEE187 pKa = 4.3VVSVEE192 pKa = 3.55YY193 pKa = 11.57SMISEE198 pKa = 4.43EE199 pKa = 4.13NTEE202 pKa = 4.23GG203 pKa = 3.75
MM1 pKa = 7.71KK2 pKa = 10.32KK3 pKa = 10.35NKK5 pKa = 9.09TPFIIAAAVLIAVGIAVLVFINQGNGNEE33 pKa = 4.43NIGDD37 pKa = 3.89KK38 pKa = 10.69NVSSNADD45 pKa = 3.25EE46 pKa = 4.71NGDD49 pKa = 3.68VKK51 pKa = 10.97DD52 pKa = 3.84TGEE55 pKa = 4.01TGQNNGNIGEE65 pKa = 4.2RR66 pKa = 11.84KK67 pKa = 9.73GYY69 pKa = 8.09YY70 pKa = 9.42FEE72 pKa = 4.39YY73 pKa = 10.23KK74 pKa = 10.34GVEE77 pKa = 3.38IGINDD82 pKa = 3.49EE83 pKa = 3.89AAPIIEE89 pKa = 4.35ALGEE93 pKa = 3.81PMNYY97 pKa = 9.56FEE99 pKa = 5.75APSCAFEE106 pKa = 4.86GMDD109 pKa = 4.86KK110 pKa = 10.23IYY112 pKa = 10.44SYY114 pKa = 11.59SGFEE118 pKa = 3.74FTTYY122 pKa = 10.36TKK124 pKa = 10.61DD125 pKa = 3.2GKK127 pKa = 10.62DD128 pKa = 3.66YY129 pKa = 10.68IASLVFLDD137 pKa = 3.95DD138 pKa = 3.42TVTTRR143 pKa = 11.84EE144 pKa = 4.52GITLNATLDD153 pKa = 3.96DD154 pKa = 4.54VIATYY159 pKa = 10.71GSDD162 pKa = 3.58YY163 pKa = 10.45EE164 pKa = 4.27QSFSKK169 pKa = 10.88YY170 pKa = 10.0SYY172 pKa = 11.26SDD174 pKa = 3.72GNCVLSFIIEE184 pKa = 4.07NGEE187 pKa = 4.3VVSVEE192 pKa = 3.55YY193 pKa = 11.57SMISEE198 pKa = 4.43EE199 pKa = 4.13NTEE202 pKa = 4.23GG203 pKa = 3.75
Molecular weight: 22.11 kDa
Isoelectric point according different methods:
Protein with the highest isoelectric point:
>tr|L7VSS8|L7VSS8_THES1 Phosphoribosylaminoimidazole-succinocarboxamide synthase OS=Thermoclostridium stercorarium (strain ATCC 35414 / DSM 8532 / NCIMB 11754) OX=1121335 GN=purC PE=3 SV=1
MM1 pKa = 7.36KK2 pKa = 9.43RR3 pKa = 11.84TYY5 pKa = 9.67QPKK8 pKa = 8.61KK9 pKa = 7.7RR10 pKa = 11.84QRR12 pKa = 11.84KK13 pKa = 7.92VEE15 pKa = 3.7HH16 pKa = 6.38GFRR19 pKa = 11.84KK20 pKa = 9.82RR21 pKa = 11.84MKK23 pKa = 8.53TRR25 pKa = 11.84NGRR28 pKa = 11.84KK29 pKa = 7.47VLKK32 pKa = 10.12RR33 pKa = 11.84RR34 pKa = 11.84RR35 pKa = 11.84LKK37 pKa = 10.23GRR39 pKa = 11.84KK40 pKa = 9.04RR41 pKa = 11.84LTAA44 pKa = 4.18
MM1 pKa = 7.36KK2 pKa = 9.43RR3 pKa = 11.84TYY5 pKa = 9.67QPKK8 pKa = 8.61KK9 pKa = 7.7RR10 pKa = 11.84QRR12 pKa = 11.84KK13 pKa = 7.92VEE15 pKa = 3.7HH16 pKa = 6.38GFRR19 pKa = 11.84KK20 pKa = 9.82RR21 pKa = 11.84MKK23 pKa = 8.53TRR25 pKa = 11.84NGRR28 pKa = 11.84KK29 pKa = 7.47VLKK32 pKa = 10.12RR33 pKa = 11.84RR34 pKa = 11.84RR35 pKa = 11.84LKK37 pKa = 10.23GRR39 pKa = 11.84KK40 pKa = 9.04RR41 pKa = 11.84LTAA44 pKa = 4.18
Molecular weight: 5.56 kDa
Isoelectric point according different methods:
Peptides (in silico digests for buttom-up proteomics)
Below you can find in silico digests of the whole proteome with Trypsin, Chymotrypsin, Trypsin+LysC, LysN, ArgC proteases suitable for different mass spec machines.| Try ESI |
 |
|---|
| ChTry ESI |
 |
|---|
| ArgC ESI |
 |
|---|
| LysN ESI |
 |
|---|
| TryLysC ESI |
 |
|---|
| Try MALDI |
 |
|---|
| ChTry MALDI |
 |
|---|
| ArgC MALDI |
 |
|---|
| LysN MALDI |
 |
|---|
| TryLysC MALDI |
 |
|---|
| Try LTQ |
 |
|---|
| ChTry LTQ |
 |
|---|
| ArgC LTQ |
 |
|---|
| LysN LTQ |
 |
|---|
| TryLysC LTQ |
 |
|---|
| Try MSlow |
 |
|---|
| ChTry MSlow |
 |
|---|
| ArgC MSlow |
 |
|---|
| LysN MSlow |
 |
|---|
| TryLysC MSlow |
 |
|---|
| Try MShigh |
 |
|---|
| ChTry MShigh |
 |
|---|
| ArgC MShigh |
 |
|---|
| LysN MShigh |
 |
|---|
| TryLysC MShigh |
 |
|---|
General Statistics
Number of major isoforms |
Number of additional isoforms |
Number of all proteins |
Number of amino acids |
Min. Seq. Length |
Max. Seq. Length |
Avg. Seq. Length |
Avg. Mol. Weight |
|---|---|---|---|---|---|---|---|
0 |
856082 |
30 |
1808 |
320.8 |
36.18 |
Amino acid frequency
Ala |
Cys |
Asp |
Glu |
Phe |
Gly |
His |
Ile |
Lys |
Leu |
|---|---|---|---|---|---|---|---|---|---|
6.651 ± 0.044 | 1.191 ± 0.021 |
5.344 ± 0.034 | 7.395 ± 0.048 |
4.457 ± 0.035 | 6.874 ± 0.036 |
1.562 ± 0.021 | 8.423 ± 0.043 |
7.106 ± 0.037 | 9.01 ± 0.045 |
Met |
Asn |
Gln |
Pro |
Arg |
Ser |
Thr |
Val |
Trp |
Tyr |
|---|---|---|---|---|---|---|---|---|---|
2.712 ± 0.02 | 5.036 ± 0.031 |
3.655 ± 0.026 | 2.577 ± 0.029 |
4.858 ± 0.033 | 5.707 ± 0.039 |
5.131 ± 0.032 | 7.164 ± 0.037 |
0.935 ± 0.019 | 4.211 ± 0.034 |
Most of the basic statistics you can see at this page can be downloaded from this CSV file
Proteome-pI is available under Creative Commons Attribution-NoDerivs license, for more details see here
| Reference: Kozlowski LP. Proteome-pI 2.0: Proteome Isoelectric Point Database Update. Nucleic Acids Res. 2021, doi: 10.1093/nar/gkab944 | Contact: Lukasz P. Kozlowski |
