Nonlabens sediminis
Taxonomy: cellular organisms; Bacteria; FCB group; Bacteroidetes/Chlorobi group; Bacteroidetes; Flavobacteriia; Flavobacteriales; Flavobacteriaceae; Nonlabens
Average proteome isoelectric point is 6.37
Get precalculated fractions of proteins

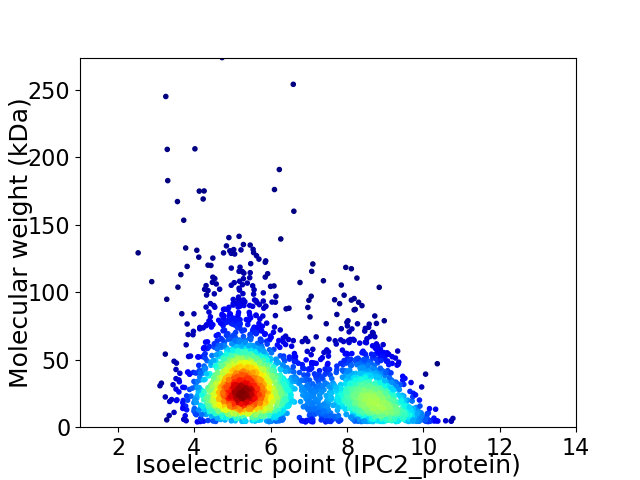
Virtual 2D-PAGE plot for 2951 proteins (isoelectric point calculated using IPC2_protein)
Get csv file with sequences according to given criteria:
* You can choose from 21 different methods for calculating isoelectric point
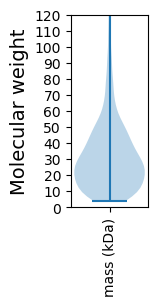
Summary statistics related to proteome-wise predictions


Protein with the lowest isoelectric point:
>tr|A0A090PXP2|A0A090PXP2_9FLAO Uncharacterized protein OS=Nonlabens sediminis OX=319236 GN=JCM19294_2287 PE=4 SV=1
MM1 pKa = 7.2VSCDD5 pKa = 3.79EE6 pKa = 5.69DD7 pKa = 3.67PTLSNDD13 pKa = 3.4QNQGDD18 pKa = 4.52DD19 pKa = 5.09DD20 pKa = 3.9ITTIDD25 pKa = 3.68DD26 pKa = 3.83KK27 pKa = 11.79VRR29 pKa = 11.84LSSIQIAEE37 pKa = 4.11NTASNIVTNIDD48 pKa = 2.79IVYY51 pKa = 10.7DD52 pKa = 3.65NDD54 pKa = 3.41NLISEE59 pKa = 4.73IVFSGQQSKK68 pKa = 8.6TYY70 pKa = 9.77QFQYY74 pKa = 11.06APNNQVINYY83 pKa = 7.26TKK85 pKa = 10.11IEE87 pKa = 4.06NQSTSSYY94 pKa = 10.22SIEE97 pKa = 3.84YY98 pKa = 9.91DD99 pKa = 3.4EE100 pKa = 6.26NIITSSNVSNPNQIQQFEE118 pKa = 4.16IDD120 pKa = 3.26NFNRR124 pKa = 11.84VDD126 pKa = 4.15EE127 pKa = 4.44ILSRR131 pKa = 11.84TTSSNGSVIQEE142 pKa = 3.85NSEE145 pKa = 4.1VFDD148 pKa = 3.74INANFNIEE156 pKa = 4.28RR157 pKa = 11.84ITYY160 pKa = 10.13LEE162 pKa = 4.16NNNTTGFSDD171 pKa = 3.77FTYY174 pKa = 10.53EE175 pKa = 5.24LNDD178 pKa = 4.02NPFKK182 pKa = 11.22DD183 pKa = 3.54MNDD186 pKa = 3.67IIRR189 pKa = 11.84LLVFKK194 pKa = 10.58DD195 pKa = 5.35FIPSSRR201 pKa = 11.84FLPLTQEE208 pKa = 4.46EE209 pKa = 5.43YY210 pKa = 9.36DD211 pKa = 3.58TSTGSIQLVQEE222 pKa = 4.19MIYY225 pKa = 9.99TYY227 pKa = 11.0NLNSEE232 pKa = 4.29GMPVSRR238 pKa = 11.84EE239 pKa = 3.33ISTTNNGISSTSYY252 pKa = 11.5NLFSYY257 pKa = 10.51LL258 pKa = 3.99
MM1 pKa = 7.2VSCDD5 pKa = 3.79EE6 pKa = 5.69DD7 pKa = 3.67PTLSNDD13 pKa = 3.4QNQGDD18 pKa = 4.52DD19 pKa = 5.09DD20 pKa = 3.9ITTIDD25 pKa = 3.68DD26 pKa = 3.83KK27 pKa = 11.79VRR29 pKa = 11.84LSSIQIAEE37 pKa = 4.11NTASNIVTNIDD48 pKa = 2.79IVYY51 pKa = 10.7DD52 pKa = 3.65NDD54 pKa = 3.41NLISEE59 pKa = 4.73IVFSGQQSKK68 pKa = 8.6TYY70 pKa = 9.77QFQYY74 pKa = 11.06APNNQVINYY83 pKa = 7.26TKK85 pKa = 10.11IEE87 pKa = 4.06NQSTSSYY94 pKa = 10.22SIEE97 pKa = 3.84YY98 pKa = 9.91DD99 pKa = 3.4EE100 pKa = 6.26NIITSSNVSNPNQIQQFEE118 pKa = 4.16IDD120 pKa = 3.26NFNRR124 pKa = 11.84VDD126 pKa = 4.15EE127 pKa = 4.44ILSRR131 pKa = 11.84TTSSNGSVIQEE142 pKa = 3.85NSEE145 pKa = 4.1VFDD148 pKa = 3.74INANFNIEE156 pKa = 4.28RR157 pKa = 11.84ITYY160 pKa = 10.13LEE162 pKa = 4.16NNNTTGFSDD171 pKa = 3.77FTYY174 pKa = 10.53EE175 pKa = 5.24LNDD178 pKa = 4.02NPFKK182 pKa = 11.22DD183 pKa = 3.54MNDD186 pKa = 3.67IIRR189 pKa = 11.84LLVFKK194 pKa = 10.58DD195 pKa = 5.35FIPSSRR201 pKa = 11.84FLPLTQEE208 pKa = 4.46EE209 pKa = 5.43YY210 pKa = 9.36DD211 pKa = 3.58TSTGSIQLVQEE222 pKa = 4.19MIYY225 pKa = 9.99TYY227 pKa = 11.0NLNSEE232 pKa = 4.29GMPVSRR238 pKa = 11.84EE239 pKa = 3.33ISTTNNGISSTSYY252 pKa = 11.5NLFSYY257 pKa = 10.51LL258 pKa = 3.99
Molecular weight: 29.39 kDa
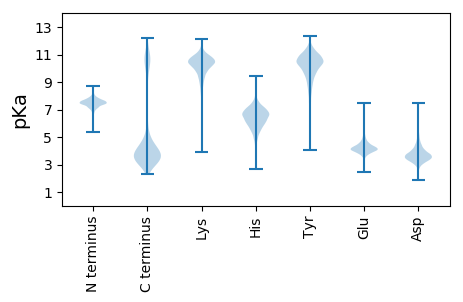
Isoelectric point according different methods:
Protein with the highest isoelectric point:
>tr|A0A090Q4B2|A0A090Q4B2_9FLAO Sulf_transp domain-containing protein OS=Nonlabens sediminis OX=319236 GN=JCM19294_1556 PE=3 SV=1
MM1 pKa = 7.6KK2 pKa = 10.46KK3 pKa = 9.83LLKK6 pKa = 10.03YY7 pKa = 10.27SVYY10 pKa = 10.06IYY12 pKa = 10.45LIFAIVCLITAITEE26 pKa = 4.23WNVEE30 pKa = 3.78RR31 pKa = 11.84SRR33 pKa = 11.84AYY35 pKa = 11.3LMLFMAAVALFMFFFRR51 pKa = 11.84RR52 pKa = 11.84RR53 pKa = 11.84FIRR56 pKa = 11.84RR57 pKa = 11.84FDD59 pKa = 3.92DD60 pKa = 3.47RR61 pKa = 11.84NKK63 pKa = 10.95
MM1 pKa = 7.6KK2 pKa = 10.46KK3 pKa = 9.83LLKK6 pKa = 10.03YY7 pKa = 10.27SVYY10 pKa = 10.06IYY12 pKa = 10.45LIFAIVCLITAITEE26 pKa = 4.23WNVEE30 pKa = 3.78RR31 pKa = 11.84SRR33 pKa = 11.84AYY35 pKa = 11.3LMLFMAAVALFMFFFRR51 pKa = 11.84RR52 pKa = 11.84RR53 pKa = 11.84FIRR56 pKa = 11.84RR57 pKa = 11.84FDD59 pKa = 3.92DD60 pKa = 3.47RR61 pKa = 11.84NKK63 pKa = 10.95
Molecular weight: 7.81 kDa
Isoelectric point according different methods:
Peptides (in silico digests for buttom-up proteomics)
Below you can find in silico digests of the whole proteome with Trypsin, Chymotrypsin, Trypsin+LysC, LysN, ArgC proteases suitable for different mass spec machines.| Try ESI |
 |
|---|
| ChTry ESI |
 |
|---|
| ArgC ESI |
 |
|---|
| LysN ESI |
 |
|---|
| TryLysC ESI |
 |
|---|
| Try MALDI |
 |
|---|
| ChTry MALDI |
 |
|---|
| ArgC MALDI |
 |
|---|
| LysN MALDI |
 |
|---|
| TryLysC MALDI |
 |
|---|
| Try LTQ |
 |
|---|
| ChTry LTQ |
 |
|---|
| ArgC LTQ |
 |
|---|
| LysN LTQ |
 |
|---|
| TryLysC LTQ |
 |
|---|
| Try MSlow |
 |
|---|
| ChTry MSlow |
 |
|---|
| ArgC MSlow |
 |
|---|
| LysN MSlow |
 |
|---|
| TryLysC MSlow |
 |
|---|
| Try MShigh |
 |
|---|
| ChTry MShigh |
 |
|---|
| ArgC MShigh |
 |
|---|
| LysN MShigh |
 |
|---|
| TryLysC MShigh |
 |
|---|
General Statistics
Number of major isoforms |
Number of additional isoforms |
Number of all proteins |
Number of amino acids |
Min. Seq. Length |
Max. Seq. Length |
Avg. Seq. Length |
Avg. Mol. Weight |
|---|---|---|---|---|---|---|---|
0 |
886951 |
37 |
2417 |
300.6 |
33.91 |
Amino acid frequency
Ala |
Cys |
Asp |
Glu |
Phe |
Gly |
His |
Ile |
Lys |
Leu |
|---|---|---|---|---|---|---|---|---|---|
6.462 ± 0.042 | 0.724 ± 0.015 |
6.027 ± 0.044 | 6.437 ± 0.047 |
4.892 ± 0.035 | 6.369 ± 0.045 |
1.856 ± 0.023 | 7.616 ± 0.042 |
6.978 ± 0.07 | 9.186 ± 0.062 |
Met |
Asn |
Gln |
Pro |
Arg |
Ser |
Thr |
Val |
Trp |
Tyr |
|---|---|---|---|---|---|---|---|---|---|
2.249 ± 0.031 | 6.044 ± 0.056 |
3.456 ± 0.029 | 3.87 ± 0.031 |
3.833 ± 0.032 | 6.575 ± 0.044 |
5.845 ± 0.054 | 6.379 ± 0.034 |
1.079 ± 0.017 | 4.123 ± 0.034 |
Most of the basic statistics you can see at this page can be downloaded from this CSV file
Proteome-pI is available under Creative Commons Attribution-NoDerivs license, for more details see here
| Reference: Kozlowski LP. Proteome-pI 2.0: Proteome Isoelectric Point Database Update. Nucleic Acids Res. 2021, doi: 10.1093/nar/gkab944 | Contact: Lukasz P. Kozlowski |
