Yata virus
Taxonomy: Viruses; Riboviria; Orthornavirae; Negarnaviricota; Haploviricotina; Monjiviricetes; Mononegavirales; Rhabdoviridae; Alpharhabdovirinae; Ephemerovirus; Yata ephemerovirus
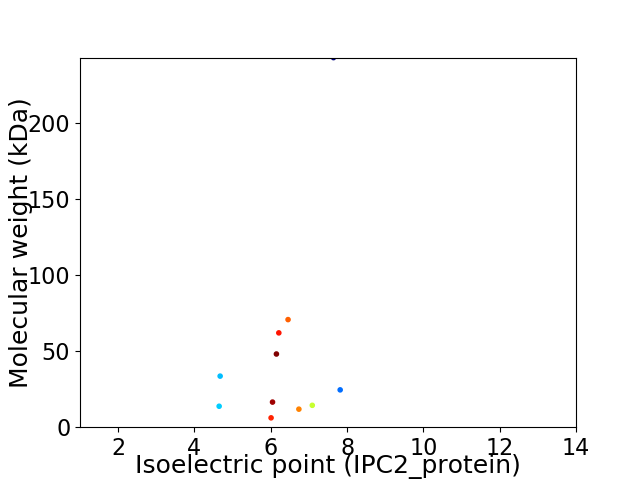
Average proteome isoelectric point is 6.26
Get precalculated fractions of proteins

Virtual 2D-PAGE plot for 11 proteins (isoelectric point calculated using IPC2_protein)
Get csv file with sequences according to given criteria:
* You can choose from 21 different methods for calculating isoelectric point
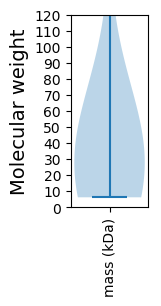
Summary statistics related to proteome-wise predictions


Protein with the lowest isoelectric point:
>tr|A0A096ZGU9|A0A096ZGU9_9RHAB GDP polyribonucleotidyltransferase OS=Yata virus OX=1272960 GN=L PE=4 SV=1
MM1 pKa = 7.68ALLLSGVLTKK11 pKa = 10.67SDD13 pKa = 3.74FQTDD17 pKa = 3.12NQLFDD22 pKa = 4.07FVEE25 pKa = 4.91KK26 pKa = 10.23IVEE29 pKa = 4.16EE30 pKa = 4.3TTRR33 pKa = 11.84LAIKK37 pKa = 10.67NSIWWSGLQFTQIEE51 pKa = 4.37RR52 pKa = 11.84EE53 pKa = 4.4VMVGMNWLVYY63 pKa = 9.97IDD65 pKa = 4.58NEE67 pKa = 3.78EE68 pKa = 4.15SDD70 pKa = 3.85RR71 pKa = 11.84VDD73 pKa = 3.07YY74 pKa = 10.97SFWFGVPDD82 pKa = 3.67SVGWRR87 pKa = 11.84MFRR90 pKa = 11.84NPNTRR95 pKa = 11.84CIASNILEE103 pKa = 4.2NRR105 pKa = 11.84QSYY108 pKa = 10.36CFIQYY113 pKa = 9.58FSQQ116 pKa = 3.45
MM1 pKa = 7.68ALLLSGVLTKK11 pKa = 10.67SDD13 pKa = 3.74FQTDD17 pKa = 3.12NQLFDD22 pKa = 4.07FVEE25 pKa = 4.91KK26 pKa = 10.23IVEE29 pKa = 4.16EE30 pKa = 4.3TTRR33 pKa = 11.84LAIKK37 pKa = 10.67NSIWWSGLQFTQIEE51 pKa = 4.37RR52 pKa = 11.84EE53 pKa = 4.4VMVGMNWLVYY63 pKa = 9.97IDD65 pKa = 4.58NEE67 pKa = 3.78EE68 pKa = 4.15SDD70 pKa = 3.85RR71 pKa = 11.84VDD73 pKa = 3.07YY74 pKa = 10.97SFWFGVPDD82 pKa = 3.67SVGWRR87 pKa = 11.84MFRR90 pKa = 11.84NPNTRR95 pKa = 11.84CIASNILEE103 pKa = 4.2NRR105 pKa = 11.84QSYY108 pKa = 10.36CFIQYY113 pKa = 9.58FSQQ116 pKa = 3.45
Molecular weight: 13.77 kDa
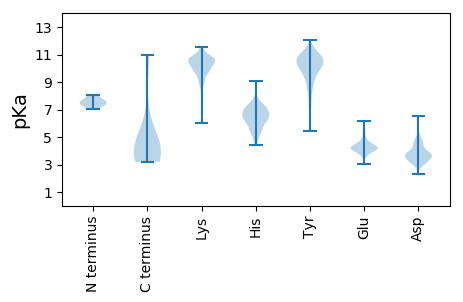
Isoelectric point according different methods:
Protein with the highest isoelectric point:
>tr|A0A096ZGV7|A0A096ZGV7_9RHAB Isoform of A0A096ZGU4 Alpha2x protein OS=Yata virus OX=1272960 GN=alpha2 PE=4 SV=1
MM1 pKa = 7.07IARR4 pKa = 11.84WRR6 pKa = 11.84KK7 pKa = 9.69DD8 pKa = 3.23RR9 pKa = 11.84ADD11 pKa = 3.59KK12 pKa = 10.9AKK14 pKa = 10.35KK15 pKa = 9.98DD16 pKa = 3.73SPPEE20 pKa = 3.97YY21 pKa = 10.17SSSSSLWMSTAPAYY35 pKa = 10.35DD36 pKa = 3.72GSFGPIFHH44 pKa = 6.72NPKK47 pKa = 10.2PEE49 pKa = 3.87PTKK52 pKa = 9.36QAFMIEE58 pKa = 4.28CSLEE62 pKa = 4.28VISKK66 pKa = 9.99KK67 pKa = 8.58QVEE70 pKa = 4.8GVKK73 pKa = 10.77GMLKK77 pKa = 9.97ILDD80 pKa = 4.33HH81 pKa = 7.12LVDD84 pKa = 4.61NYY86 pKa = 11.39DD87 pKa = 2.94GSYY90 pKa = 8.62WGKK93 pKa = 8.99PLIVMMYY100 pKa = 10.03LVLGTHH106 pKa = 6.06MEE108 pKa = 4.21SKK110 pKa = 10.62SRR112 pKa = 11.84IGIDD116 pKa = 2.58SWIYY120 pKa = 10.06QRR122 pKa = 11.84SLSEE126 pKa = 3.57AVYY129 pKa = 10.17IITEE133 pKa = 4.48TPVSMTSSGLTYY145 pKa = 11.06NNYY148 pKa = 8.29TQTTYY153 pKa = 10.87LGEE156 pKa = 4.39PASVTYY162 pKa = 10.41SFKK165 pKa = 10.3ATPTKK170 pKa = 10.25RR171 pKa = 11.84YY172 pKa = 8.76SRR174 pKa = 11.84PIIGAYY180 pKa = 9.31KK181 pKa = 10.39LPLANGLPPPEE192 pKa = 4.8LNDD195 pKa = 3.1VLRR198 pKa = 11.84YY199 pKa = 9.92YY200 pKa = 11.4GLTTRR205 pKa = 11.84IQDD208 pKa = 3.48NGEE211 pKa = 4.01SSVEE215 pKa = 3.9FLPP218 pKa = 5.13
MM1 pKa = 7.07IARR4 pKa = 11.84WRR6 pKa = 11.84KK7 pKa = 9.69DD8 pKa = 3.23RR9 pKa = 11.84ADD11 pKa = 3.59KK12 pKa = 10.9AKK14 pKa = 10.35KK15 pKa = 9.98DD16 pKa = 3.73SPPEE20 pKa = 3.97YY21 pKa = 10.17SSSSSLWMSTAPAYY35 pKa = 10.35DD36 pKa = 3.72GSFGPIFHH44 pKa = 6.72NPKK47 pKa = 10.2PEE49 pKa = 3.87PTKK52 pKa = 9.36QAFMIEE58 pKa = 4.28CSLEE62 pKa = 4.28VISKK66 pKa = 9.99KK67 pKa = 8.58QVEE70 pKa = 4.8GVKK73 pKa = 10.77GMLKK77 pKa = 9.97ILDD80 pKa = 4.33HH81 pKa = 7.12LVDD84 pKa = 4.61NYY86 pKa = 11.39DD87 pKa = 2.94GSYY90 pKa = 8.62WGKK93 pKa = 8.99PLIVMMYY100 pKa = 10.03LVLGTHH106 pKa = 6.06MEE108 pKa = 4.21SKK110 pKa = 10.62SRR112 pKa = 11.84IGIDD116 pKa = 2.58SWIYY120 pKa = 10.06QRR122 pKa = 11.84SLSEE126 pKa = 3.57AVYY129 pKa = 10.17IITEE133 pKa = 4.48TPVSMTSSGLTYY145 pKa = 11.06NNYY148 pKa = 8.29TQTTYY153 pKa = 10.87LGEE156 pKa = 4.39PASVTYY162 pKa = 10.41SFKK165 pKa = 10.3ATPTKK170 pKa = 10.25RR171 pKa = 11.84YY172 pKa = 8.76SRR174 pKa = 11.84PIIGAYY180 pKa = 9.31KK181 pKa = 10.39LPLANGLPPPEE192 pKa = 4.8LNDD195 pKa = 3.1VLRR198 pKa = 11.84YY199 pKa = 9.92YY200 pKa = 11.4GLTTRR205 pKa = 11.84IQDD208 pKa = 3.48NGEE211 pKa = 4.01SSVEE215 pKa = 3.9FLPP218 pKa = 5.13
Molecular weight: 24.53 kDa
Isoelectric point according different methods:
Peptides (in silico digests for buttom-up proteomics)
Below you can find in silico digests of the whole proteome with Trypsin, Chymotrypsin, Trypsin+LysC, LysN, ArgC proteases suitable for different mass spec machines.| Try ESI |
 |
|---|
| ChTry ESI |
 |
|---|
| ArgC ESI |
 |
|---|
| LysN ESI |
 |
|---|
| TryLysC ESI |
 |
|---|
| Try MALDI |
 |
|---|
| ChTry MALDI |
 |
|---|
| ArgC MALDI |
 |
|---|
| LysN MALDI |
 |
|---|
| TryLysC MALDI |
 |
|---|
| Try LTQ |
 |
|---|
| ChTry LTQ |
 |
|---|
| ArgC LTQ |
 |
|---|
| LysN LTQ |
 |
|---|
| TryLysC LTQ |
 |
|---|
| Try MSlow |
 |
|---|
| ChTry MSlow |
 |
|---|
| ArgC MSlow |
 |
|---|
| LysN MSlow |
 |
|---|
| TryLysC MSlow |
 |
|---|
| Try MShigh |
 |
|---|
| ChTry MShigh |
 |
|---|
| ArgC MShigh |
 |
|---|
| LysN MShigh |
 |
|---|
| TryLysC MShigh |
 |
|---|
General Statistics
Number of major isoforms |
Number of additional isoforms |
Number of all proteins |
Number of amino acids |
Min. Seq. Length |
Max. Seq. Length |
Avg. Seq. Length |
Avg. Mol. Weight |
|---|---|---|---|---|---|---|---|
4743 |
53 |
2117 |
431.2 |
49.49 |
Amino acid frequency
Ala |
Cys |
Asp |
Glu |
Phe |
Gly |
His |
Ile |
Lys |
Leu |
|---|---|---|---|---|---|---|---|---|---|
3.563 ± 0.472 | 1.982 ± 0.284 |
5.988 ± 0.312 | 6.156 ± 0.413 |
3.9 ± 0.312 | 5.882 ± 0.328 |
2.277 ± 0.186 | 8.202 ± 0.402 |
7.147 ± 0.266 | 9.994 ± 0.47 |
Met |
Asn |
Gln |
Pro |
Arg |
Ser |
Thr |
Val |
Trp |
Tyr |
|---|---|---|---|---|---|---|---|---|---|
2.635 ± 0.31 | 5.376 ± 0.295 |
4.132 ± 0.425 | 2.867 ± 0.13 |
4.786 ± 0.349 | 7.506 ± 0.442 |
5.925 ± 0.171 | 5.355 ± 0.226 |
1.855 ± 0.168 | 4.47 ± 0.484 |
Most of the basic statistics you can see at this page can be downloaded from this CSV file
Proteome-pI is available under Creative Commons Attribution-NoDerivs license, for more details see here
| Reference: Kozlowski LP. Proteome-pI 2.0: Proteome Isoelectric Point Database Update. Nucleic Acids Res. 2021, doi: 10.1093/nar/gkab944 | Contact: Lukasz P. Kozlowski |
