Human papillomavirus 11
Taxonomy: Viruses; Monodnaviria; Shotokuvirae; Cossaviricota; Papovaviricetes; Zurhausenvirales; Papillomaviridae; Firstpapillomavirinae; Alphapapillomavirus; Alphapapillomavirus 10
Average proteome isoelectric point is 6.56
Get precalculated fractions of proteins

Virtual 2D-PAGE plot for 10 proteins (isoelectric point calculated using IPC2_protein)
Get csv file with sequences according to given criteria:
* You can choose from 21 different methods for calculating isoelectric point
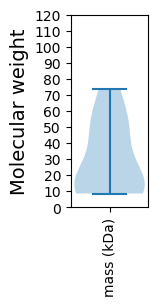
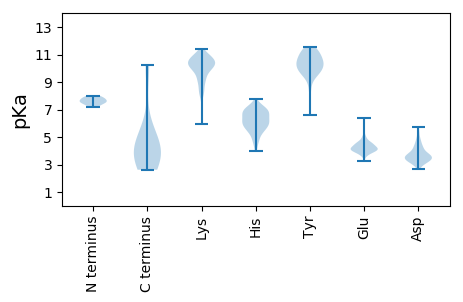
Summary statistics related to proteome-wise predictions


Protein with the lowest isoelectric point:
>sp|P0DKA1|VE8E2_HPV11 Protein E8^E2C OS=Human papillomavirus 11 OX=10580 PE=3 SV=1
MM1 pKa = 7.58HH2 pKa = 7.07GRR4 pKa = 11.84LVTLKK9 pKa = 10.82DD10 pKa = 3.21IVLDD14 pKa = 4.05LQPPDD19 pKa = 3.7PVGLHH24 pKa = 6.81CYY26 pKa = 8.4EE27 pKa = 4.04QLEE30 pKa = 4.49DD31 pKa = 3.73SSEE34 pKa = 4.46DD35 pKa = 3.66EE36 pKa = 3.83VDD38 pKa = 5.0KK39 pKa = 11.44VDD41 pKa = 4.56KK42 pKa = 10.96QDD44 pKa = 3.67AQPLTQHH51 pKa = 5.55YY52 pKa = 10.26QILTCCCGCDD62 pKa = 3.33SNVRR66 pKa = 11.84LVVEE70 pKa = 4.68CTDD73 pKa = 2.97GDD75 pKa = 3.62IRR77 pKa = 11.84QLQDD81 pKa = 3.84LLLGTLNIVCPICAPKK97 pKa = 9.98PP98 pKa = 3.56
MM1 pKa = 7.58HH2 pKa = 7.07GRR4 pKa = 11.84LVTLKK9 pKa = 10.82DD10 pKa = 3.21IVLDD14 pKa = 4.05LQPPDD19 pKa = 3.7PVGLHH24 pKa = 6.81CYY26 pKa = 8.4EE27 pKa = 4.04QLEE30 pKa = 4.49DD31 pKa = 3.73SSEE34 pKa = 4.46DD35 pKa = 3.66EE36 pKa = 3.83VDD38 pKa = 5.0KK39 pKa = 11.44VDD41 pKa = 4.56KK42 pKa = 10.96QDD44 pKa = 3.67AQPLTQHH51 pKa = 5.55YY52 pKa = 10.26QILTCCCGCDD62 pKa = 3.33SNVRR66 pKa = 11.84LVVEE70 pKa = 4.68CTDD73 pKa = 2.97GDD75 pKa = 3.62IRR77 pKa = 11.84QLQDD81 pKa = 3.84LLLGTLNIVCPICAPKK97 pKa = 9.98PP98 pKa = 3.56
Molecular weight: 10.89 kDa
Isoelectric point according different methods:
Protein with the highest isoelectric point:
>sp|P69901|VE5B_HPV11 Probable protein E5B OS=Human papillomavirus 11 OX=10580 PE=4 SV=1
MM1 pKa = 8.0AILKK5 pKa = 8.93WKK7 pKa = 9.15LQRR10 pKa = 11.84STVRR14 pKa = 11.84EE15 pKa = 3.8VSIAEE20 pKa = 4.03PTTYY24 pKa = 10.43TPAQTTAPTVSACTTEE40 pKa = 5.05DD41 pKa = 3.67GVSAPPRR48 pKa = 11.84KK49 pKa = 9.19RR50 pKa = 11.84ARR52 pKa = 11.84GPSTNNTLCVANIRR66 pKa = 11.84SVDD69 pKa = 3.46STINNIVTDD78 pKa = 4.35NYY80 pKa = 11.13NKK82 pKa = 9.88HH83 pKa = 4.73QRR85 pKa = 11.84RR86 pKa = 11.84NNCHH90 pKa = 6.05SAATPIVQLQGDD102 pKa = 4.68SNCLKK107 pKa = 10.4CFRR110 pKa = 11.84YY111 pKa = 9.99RR112 pKa = 11.84LNDD115 pKa = 3.26KK116 pKa = 10.27YY117 pKa = 11.47KK118 pKa = 10.76HH119 pKa = 5.65LFEE122 pKa = 5.08LASSTWHH129 pKa = 5.89WASPEE134 pKa = 4.0APHH137 pKa = 6.82KK138 pKa = 10.52NAIVTLTYY146 pKa = 10.53SSEE149 pKa = 3.97EE150 pKa = 3.71QRR152 pKa = 11.84QQFLNSVKK160 pKa = 9.74IPPTIRR166 pKa = 11.84HH167 pKa = 5.49KK168 pKa = 10.91VGFMSLHH175 pKa = 6.16LLL177 pKa = 3.85
MM1 pKa = 8.0AILKK5 pKa = 8.93WKK7 pKa = 9.15LQRR10 pKa = 11.84STVRR14 pKa = 11.84EE15 pKa = 3.8VSIAEE20 pKa = 4.03PTTYY24 pKa = 10.43TPAQTTAPTVSACTTEE40 pKa = 5.05DD41 pKa = 3.67GVSAPPRR48 pKa = 11.84KK49 pKa = 9.19RR50 pKa = 11.84ARR52 pKa = 11.84GPSTNNTLCVANIRR66 pKa = 11.84SVDD69 pKa = 3.46STINNIVTDD78 pKa = 4.35NYY80 pKa = 11.13NKK82 pKa = 9.88HH83 pKa = 4.73QRR85 pKa = 11.84RR86 pKa = 11.84NNCHH90 pKa = 6.05SAATPIVQLQGDD102 pKa = 4.68SNCLKK107 pKa = 10.4CFRR110 pKa = 11.84YY111 pKa = 9.99RR112 pKa = 11.84LNDD115 pKa = 3.26KK116 pKa = 10.27YY117 pKa = 11.47KK118 pKa = 10.76HH119 pKa = 5.65LFEE122 pKa = 5.08LASSTWHH129 pKa = 5.89WASPEE134 pKa = 4.0APHH137 pKa = 6.82KK138 pKa = 10.52NAIVTLTYY146 pKa = 10.53SSEE149 pKa = 3.97EE150 pKa = 3.71QRR152 pKa = 11.84QQFLNSVKK160 pKa = 9.74IPPTIRR166 pKa = 11.84HH167 pKa = 5.49KK168 pKa = 10.91VGFMSLHH175 pKa = 6.16LLL177 pKa = 3.85
Molecular weight: 19.95 kDa
Isoelectric point according different methods:
Peptides (in silico digests for buttom-up proteomics)
Below you can find in silico digests of the whole proteome with Trypsin, Chymotrypsin, Trypsin+LysC, LysN, ArgC proteases suitable for different mass spec machines.| Try ESI |
 |
|---|
| ChTry ESI |
 |
|---|
| ArgC ESI |
 |
|---|
| LysN ESI |
 |
|---|
| TryLysC ESI |
 |
|---|
| Try MALDI |
 |
|---|
| ChTry MALDI |
 |
|---|
| ArgC MALDI |
 |
|---|
| LysN MALDI |
 |
|---|
| TryLysC MALDI |
 |
|---|
| Try LTQ |
 |
|---|
| ChTry LTQ |
 |
|---|
| ArgC LTQ |
 |
|---|
| LysN LTQ |
 |
|---|
| TryLysC LTQ |
 |
|---|
| Try MSlow |
 |
|---|
| ChTry MSlow |
 |
|---|
| ArgC MSlow |
 |
|---|
| LysN MSlow |
 |
|---|
| TryLysC MSlow |
 |
|---|
| Try MShigh |
 |
|---|
| ChTry MShigh |
 |
|---|
| ArgC MShigh |
 |
|---|
| LysN MShigh |
 |
|---|
| TryLysC MShigh |
 |
|---|
General Statistics
Number of major isoforms |
Number of additional isoforms |
Number of all proteins |
Number of amino acids |
Min. Seq. Length |
Max. Seq. Length |
Avg. Seq. Length |
Avg. Mol. Weight |
|---|---|---|---|---|---|---|---|
0 |
2652 |
74 |
649 |
265.2 |
29.72 |
Amino acid frequency
Ala |
Cys |
Asp |
Glu |
Phe |
Gly |
His |
Ile |
Lys |
Leu |
|---|---|---|---|---|---|---|---|---|---|
6.222 ± 0.449 | 2.828 ± 0.665 |
5.354 ± 0.676 | 5.053 ± 0.787 |
3.733 ± 0.381 | 5.317 ± 0.787 |
3.017 ± 0.289 | 5.166 ± 0.709 |
5.128 ± 0.825 | 8.522 ± 1.154 |
Met |
Asn |
Gln |
Pro |
Arg |
Ser |
Thr |
Val |
Trp |
Tyr |
|---|---|---|---|---|---|---|---|---|---|
1.848 ± 0.292 | 4.223 ± 0.629 |
6.373 ± 1.285 | 4.299 ± 0.359 |
4.713 ± 0.382 | 7.504 ± 0.681 |
8.145 ± 0.803 | 7.315 ± 0.574 |
1.621 ± 0.215 | 3.62 ± 0.396 |
Most of the basic statistics you can see at this page can be downloaded from this CSV file
Proteome-pI is available under Creative Commons Attribution-NoDerivs license, for more details see here
| Reference: Kozlowski LP. Proteome-pI 2.0: Proteome Isoelectric Point Database Update. Nucleic Acids Res. 2021, doi: 10.1093/nar/gkab944 | Contact: Lukasz P. Kozlowski |
