Corynebacterium vitaeruminis DSM 20294
Taxonomy: cellular organisms; Bacteria; Terrabacteria group; Actinobacteria; Actinomycetia; Corynebacteriales; Corynebacteriaceae; Corynebacterium; Corynebacterium vitaeruminis
Average proteome isoelectric point is 5.95
Get precalculated fractions of proteins

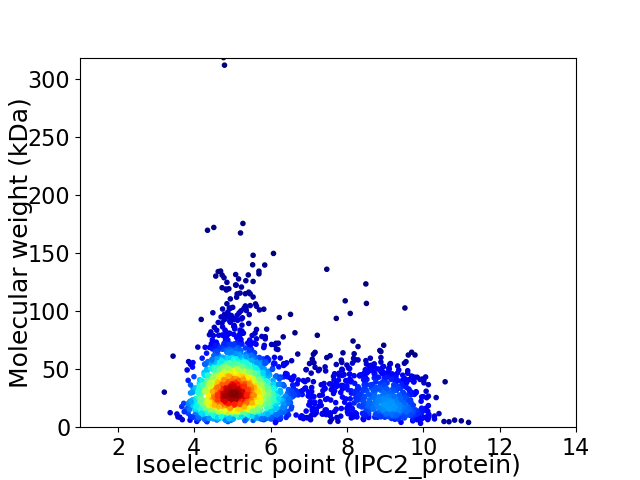
Virtual 2D-PAGE plot for 2565 proteins (isoelectric point calculated using IPC2_protein)
Get csv file with sequences according to given criteria:
* You can choose from 21 different methods for calculating isoelectric point
Summary statistics related to proteome-wise predictions


Protein with the lowest isoelectric point:
>tr|W5Y3R4|W5Y3R4_9CORY Ribonucleoside-diphosphate reductase subunit beta OS=Corynebacterium vitaeruminis DSM 20294 OX=1224164 GN=B843_10600 PE=3 SV=1
MM1 pKa = 7.43LSVMVTGLTVFSPASASAQDD21 pKa = 3.92SFTDD25 pKa = 4.01PSLGDD30 pKa = 3.86ALTDD34 pKa = 4.05LATALDD40 pKa = 4.22DD41 pKa = 4.33QNAADD46 pKa = 4.0TTDD49 pKa = 3.13ATGLDD54 pKa = 3.64VSASVDD60 pKa = 3.24AADD63 pKa = 3.71ITDD66 pKa = 3.57SAEE69 pKa = 4.09AVSVDD74 pKa = 3.63PGAAALIDD82 pKa = 3.56QSLQGVGQSIGEE94 pKa = 4.0LDD96 pKa = 3.8AATGLAFGPQLAFVAPMAVTDD117 pKa = 4.64PFAPTPVFTEE127 pKa = 4.08DD128 pKa = 4.83FEE130 pKa = 6.21NGTNNTTPTKK140 pKa = 10.44LSDD143 pKa = 3.89YY144 pKa = 10.73IGATNSTTYY153 pKa = 10.39SASGYY158 pKa = 8.22WLNPGYY164 pKa = 10.83CNGFITSFATNLSQDD179 pKa = 4.41NIDD182 pKa = 3.8KK183 pKa = 10.61LYY185 pKa = 10.42CGRR188 pKa = 11.84NGGFDD193 pKa = 3.69PGDD196 pKa = 3.38YY197 pKa = 9.34WAVRR201 pKa = 11.84SKK203 pKa = 11.21VLALGSFSNVPAGTIVTGNEE223 pKa = 3.77SATGKK228 pKa = 10.21FNHH231 pKa = 6.82ALSTNTSGGTPSGVMFQTTKK251 pKa = 10.93DD252 pKa = 3.0IVLPGSSGGRR262 pKa = 11.84FYY264 pKa = 11.5AFSVDD269 pKa = 3.89AAVTGCSNTGSGNSGQVNPNMYY291 pKa = 9.76FQMVQGGKK299 pKa = 8.57TISLPNNGNIDD310 pKa = 3.74PCSSPDD316 pKa = 3.2SRR318 pKa = 11.84QFDD321 pKa = 3.44VTAQYY326 pKa = 10.96GYY328 pKa = 10.74QGGSWGTQSGWIATGKK344 pKa = 10.63VGTFYY349 pKa = 11.03SGAFALDD356 pKa = 3.47NSASVGLILQNSSYY370 pKa = 11.24ASSTGRR376 pKa = 11.84GIANGSSGTYY386 pKa = 9.44PNSPTGRR393 pKa = 11.84RR394 pKa = 11.84TT395 pKa = 3.12
MM1 pKa = 7.43LSVMVTGLTVFSPASASAQDD21 pKa = 3.92SFTDD25 pKa = 4.01PSLGDD30 pKa = 3.86ALTDD34 pKa = 4.05LATALDD40 pKa = 4.22DD41 pKa = 4.33QNAADD46 pKa = 4.0TTDD49 pKa = 3.13ATGLDD54 pKa = 3.64VSASVDD60 pKa = 3.24AADD63 pKa = 3.71ITDD66 pKa = 3.57SAEE69 pKa = 4.09AVSVDD74 pKa = 3.63PGAAALIDD82 pKa = 3.56QSLQGVGQSIGEE94 pKa = 4.0LDD96 pKa = 3.8AATGLAFGPQLAFVAPMAVTDD117 pKa = 4.64PFAPTPVFTEE127 pKa = 4.08DD128 pKa = 4.83FEE130 pKa = 6.21NGTNNTTPTKK140 pKa = 10.44LSDD143 pKa = 3.89YY144 pKa = 10.73IGATNSTTYY153 pKa = 10.39SASGYY158 pKa = 8.22WLNPGYY164 pKa = 10.83CNGFITSFATNLSQDD179 pKa = 4.41NIDD182 pKa = 3.8KK183 pKa = 10.61LYY185 pKa = 10.42CGRR188 pKa = 11.84NGGFDD193 pKa = 3.69PGDD196 pKa = 3.38YY197 pKa = 9.34WAVRR201 pKa = 11.84SKK203 pKa = 11.21VLALGSFSNVPAGTIVTGNEE223 pKa = 3.77SATGKK228 pKa = 10.21FNHH231 pKa = 6.82ALSTNTSGGTPSGVMFQTTKK251 pKa = 10.93DD252 pKa = 3.0IVLPGSSGGRR262 pKa = 11.84FYY264 pKa = 11.5AFSVDD269 pKa = 3.89AAVTGCSNTGSGNSGQVNPNMYY291 pKa = 9.76FQMVQGGKK299 pKa = 8.57TISLPNNGNIDD310 pKa = 3.74PCSSPDD316 pKa = 3.2SRR318 pKa = 11.84QFDD321 pKa = 3.44VTAQYY326 pKa = 10.96GYY328 pKa = 10.74QGGSWGTQSGWIATGKK344 pKa = 10.63VGTFYY349 pKa = 11.03SGAFALDD356 pKa = 3.47NSASVGLILQNSSYY370 pKa = 11.24ASSTGRR376 pKa = 11.84GIANGSSGTYY386 pKa = 9.44PNSPTGRR393 pKa = 11.84RR394 pKa = 11.84TT395 pKa = 3.12
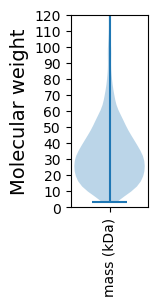
Molecular weight: 40.31 kDa
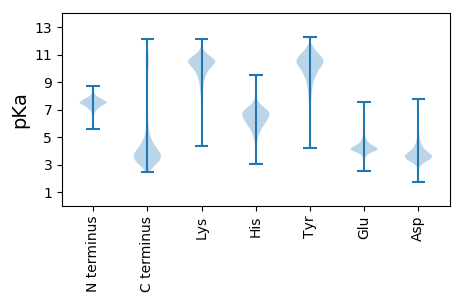
Isoelectric point according different methods:
Protein with the highest isoelectric point:
>tr|W5Y5R0|W5Y5R0_9CORY 50S ribosomal protein L2 OS=Corynebacterium vitaeruminis DSM 20294 OX=1224164 GN=rplB PE=3 SV=1
MM1 pKa = 7.4GSVIKK6 pKa = 10.38KK7 pKa = 8.42RR8 pKa = 11.84RR9 pKa = 11.84KK10 pKa = 9.06RR11 pKa = 11.84MSKK14 pKa = 9.76KK15 pKa = 9.54KK16 pKa = 9.72HH17 pKa = 5.63RR18 pKa = 11.84KK19 pKa = 7.56LLRR22 pKa = 11.84RR23 pKa = 11.84TRR25 pKa = 11.84VQRR28 pKa = 11.84RR29 pKa = 11.84KK30 pKa = 10.11LGKK33 pKa = 9.87
MM1 pKa = 7.4GSVIKK6 pKa = 10.38KK7 pKa = 8.42RR8 pKa = 11.84RR9 pKa = 11.84KK10 pKa = 9.06RR11 pKa = 11.84MSKK14 pKa = 9.76KK15 pKa = 9.54KK16 pKa = 9.72HH17 pKa = 5.63RR18 pKa = 11.84KK19 pKa = 7.56LLRR22 pKa = 11.84RR23 pKa = 11.84TRR25 pKa = 11.84VQRR28 pKa = 11.84RR29 pKa = 11.84KK30 pKa = 10.11LGKK33 pKa = 9.87
Molecular weight: 4.15 kDa
Isoelectric point according different methods:
Peptides (in silico digests for buttom-up proteomics)
Below you can find in silico digests of the whole proteome with Trypsin, Chymotrypsin, Trypsin+LysC, LysN, ArgC proteases suitable for different mass spec machines.| Try ESI |
 |
|---|
| ChTry ESI |
 |
|---|
| ArgC ESI |
 |
|---|
| LysN ESI |
 |
|---|
| TryLysC ESI |
 |
|---|
| Try MALDI |
 |
|---|
| ChTry MALDI |
 |
|---|
| ArgC MALDI |
 |
|---|
| LysN MALDI |
 |
|---|
| TryLysC MALDI |
 |
|---|
| Try LTQ |
 |
|---|
| ChTry LTQ |
 |
|---|
| ArgC LTQ |
 |
|---|
| LysN LTQ |
 |
|---|
| TryLysC LTQ |
 |
|---|
| Try MSlow |
 |
|---|
| ChTry MSlow |
 |
|---|
| ArgC MSlow |
 |
|---|
| LysN MSlow |
 |
|---|
| TryLysC MSlow |
 |
|---|
| Try MShigh |
 |
|---|
| ChTry MShigh |
 |
|---|
| ArgC MShigh |
 |
|---|
| LysN MShigh |
 |
|---|
| TryLysC MShigh |
 |
|---|
General Statistics
Number of major isoforms |
Number of additional isoforms |
Number of all proteins |
Number of amino acids |
Min. Seq. Length |
Max. Seq. Length |
Avg. Seq. Length |
Avg. Mol. Weight |
|---|---|---|---|---|---|---|---|
0 |
836113 |
28 |
3016 |
326.0 |
35.2 |
Amino acid frequency
Ala |
Cys |
Asp |
Glu |
Phe |
Gly |
His |
Ile |
Lys |
Leu |
|---|---|---|---|---|---|---|---|---|---|
12.086 ± 0.071 | 0.761 ± 0.014 |
5.831 ± 0.04 | 6.28 ± 0.054 |
3.409 ± 0.031 | 8.544 ± 0.041 |
2.062 ± 0.02 | 5.005 ± 0.034 |
3.364 ± 0.035 | 9.747 ± 0.058 |
Met |
Asn |
Gln |
Pro |
Arg |
Ser |
Thr |
Val |
Trp |
Tyr |
|---|---|---|---|---|---|---|---|---|---|
2.248 ± 0.022 | 2.712 ± 0.029 |
4.944 ± 0.035 | 3.171 ± 0.026 |
6.103 ± 0.045 | 5.877 ± 0.039 |
5.951 ± 0.041 | 8.276 ± 0.045 |
1.377 ± 0.021 | 2.254 ± 0.026 |
Most of the basic statistics you can see at this page can be downloaded from this CSV file
Proteome-pI is available under Creative Commons Attribution-NoDerivs license, for more details see here
| Reference: Kozlowski LP. Proteome-pI 2.0: Proteome Isoelectric Point Database Update. Nucleic Acids Res. 2021, doi: 10.1093/nar/gkab944 | Contact: Lukasz P. Kozlowski |
