Georgenia satyanarayanai
Taxonomy: cellular organisms; Bacteria; Terrabacteria group; Actinobacteria; Actinomycetia; Micrococcales; Bogoriellaceae; Georgenia
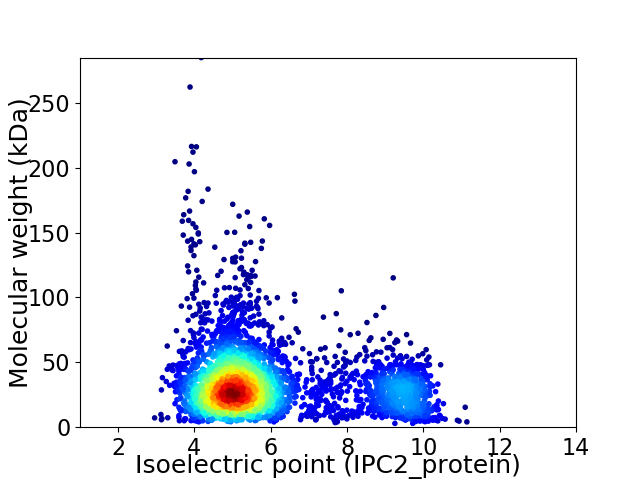
Average proteome isoelectric point is 6.0
Get precalculated fractions of proteins

Virtual 2D-PAGE plot for 3558 proteins (isoelectric point calculated using IPC2_protein)
Get csv file with sequences according to given criteria:
* You can choose from 21 different methods for calculating isoelectric point
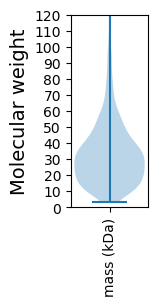
Summary statistics related to proteome-wise predictions


Protein with the lowest isoelectric point:
>tr|A0A2Y9C4N5|A0A2Y9C4N5_9MICO ATP synthase subunit a OS=Georgenia satyanarayanai OX=860221 GN=atpB PE=3 SV=1
MM1 pKa = 7.72RR2 pKa = 11.84RR3 pKa = 11.84PGTTTTALACVVVLAACGGGTDD25 pKa = 5.13DD26 pKa = 5.76DD27 pKa = 4.6AAAPAPSSSSPAEE40 pKa = 4.04DD41 pKa = 3.65VNPVIDD47 pKa = 5.97DD48 pKa = 4.57DD49 pKa = 5.57FPDD52 pKa = 4.71PDD54 pKa = 3.76VLEE57 pKa = 4.34VDD59 pKa = 3.71GTYY62 pKa = 10.47YY63 pKa = 11.06AYY65 pKa = 8.92GTNGNLRR72 pKa = 11.84NVRR75 pKa = 11.84VARR78 pKa = 11.84STDD81 pKa = 3.45LEE83 pKa = 4.13EE84 pKa = 4.28WEE86 pKa = 4.66LLEE89 pKa = 5.87DD90 pKa = 4.86ALPDD94 pKa = 3.55LPRR97 pKa = 11.84WVIPGKK103 pKa = 8.03TWAPEE108 pKa = 3.84VTEE111 pKa = 5.24LDD113 pKa = 3.81DD114 pKa = 4.92GSYY117 pKa = 11.46ALYY120 pKa = 8.51FTATNYY126 pKa = 10.61DD127 pKa = 3.91PYY129 pKa = 9.94AQCVGVATADD139 pKa = 3.49APEE142 pKa = 4.71GPFTVVGEE150 pKa = 4.19EE151 pKa = 4.01MLVCPQEE158 pKa = 3.74QGGAIDD164 pKa = 4.9ASTFTDD170 pKa = 3.41TDD172 pKa = 3.4GTRR175 pKa = 11.84YY176 pKa = 10.34LLWKK180 pKa = 10.31NDD182 pKa = 3.19GNAVGVDD189 pKa = 3.55TWLHH193 pKa = 6.1LAPLAPDD200 pKa = 3.9GLSLTGEE207 pKa = 4.28PEE209 pKa = 3.96RR210 pKa = 11.84LLKK213 pKa = 9.92QDD215 pKa = 3.7QDD217 pKa = 3.79WEE219 pKa = 4.45GHH221 pKa = 5.32LVEE224 pKa = 5.74APTLVEE230 pKa = 3.96RR231 pKa = 11.84DD232 pKa = 3.35GTYY235 pKa = 11.23VLLYY239 pKa = 10.11SANDD243 pKa = 3.63YY244 pKa = 11.24GGEE247 pKa = 4.05QYY249 pKa = 11.5AVGYY253 pKa = 8.08ATADD257 pKa = 3.47AVAGPYY263 pKa = 8.94TKK265 pKa = 10.41ADD267 pKa = 3.87EE268 pKa = 4.64PLLTTDD274 pKa = 3.1ATDD277 pKa = 3.41GRR279 pKa = 11.84FIGPGGQDD287 pKa = 2.92VVTAPDD293 pKa = 3.49GTDD296 pKa = 2.43RR297 pKa = 11.84LVFHH301 pKa = 6.79SWYY304 pKa = 10.68GDD306 pKa = 3.11TSYY309 pKa = 11.09RR310 pKa = 11.84GVNVLPLEE318 pKa = 4.39WDD320 pKa = 3.34DD321 pKa = 3.64GRR323 pKa = 11.84PVVVVPP329 pKa = 4.85
MM1 pKa = 7.72RR2 pKa = 11.84RR3 pKa = 11.84PGTTTTALACVVVLAACGGGTDD25 pKa = 5.13DD26 pKa = 5.76DD27 pKa = 4.6AAAPAPSSSSPAEE40 pKa = 4.04DD41 pKa = 3.65VNPVIDD47 pKa = 5.97DD48 pKa = 4.57DD49 pKa = 5.57FPDD52 pKa = 4.71PDD54 pKa = 3.76VLEE57 pKa = 4.34VDD59 pKa = 3.71GTYY62 pKa = 10.47YY63 pKa = 11.06AYY65 pKa = 8.92GTNGNLRR72 pKa = 11.84NVRR75 pKa = 11.84VARR78 pKa = 11.84STDD81 pKa = 3.45LEE83 pKa = 4.13EE84 pKa = 4.28WEE86 pKa = 4.66LLEE89 pKa = 5.87DD90 pKa = 4.86ALPDD94 pKa = 3.55LPRR97 pKa = 11.84WVIPGKK103 pKa = 8.03TWAPEE108 pKa = 3.84VTEE111 pKa = 5.24LDD113 pKa = 3.81DD114 pKa = 4.92GSYY117 pKa = 11.46ALYY120 pKa = 8.51FTATNYY126 pKa = 10.61DD127 pKa = 3.91PYY129 pKa = 9.94AQCVGVATADD139 pKa = 3.49APEE142 pKa = 4.71GPFTVVGEE150 pKa = 4.19EE151 pKa = 4.01MLVCPQEE158 pKa = 3.74QGGAIDD164 pKa = 4.9ASTFTDD170 pKa = 3.41TDD172 pKa = 3.4GTRR175 pKa = 11.84YY176 pKa = 10.34LLWKK180 pKa = 10.31NDD182 pKa = 3.19GNAVGVDD189 pKa = 3.55TWLHH193 pKa = 6.1LAPLAPDD200 pKa = 3.9GLSLTGEE207 pKa = 4.28PEE209 pKa = 3.96RR210 pKa = 11.84LLKK213 pKa = 9.92QDD215 pKa = 3.7QDD217 pKa = 3.79WEE219 pKa = 4.45GHH221 pKa = 5.32LVEE224 pKa = 5.74APTLVEE230 pKa = 3.96RR231 pKa = 11.84DD232 pKa = 3.35GTYY235 pKa = 11.23VLLYY239 pKa = 10.11SANDD243 pKa = 3.63YY244 pKa = 11.24GGEE247 pKa = 4.05QYY249 pKa = 11.5AVGYY253 pKa = 8.08ATADD257 pKa = 3.47AVAGPYY263 pKa = 8.94TKK265 pKa = 10.41ADD267 pKa = 3.87EE268 pKa = 4.64PLLTTDD274 pKa = 3.1ATDD277 pKa = 3.41GRR279 pKa = 11.84FIGPGGQDD287 pKa = 2.92VVTAPDD293 pKa = 3.49GTDD296 pKa = 2.43RR297 pKa = 11.84LVFHH301 pKa = 6.79SWYY304 pKa = 10.68GDD306 pKa = 3.11TSYY309 pKa = 11.09RR310 pKa = 11.84GVNVLPLEE318 pKa = 4.39WDD320 pKa = 3.34DD321 pKa = 3.64GRR323 pKa = 11.84PVVVVPP329 pKa = 4.85
Molecular weight: 35.23 kDa
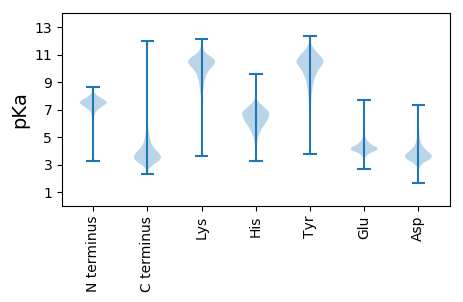
Isoelectric point according different methods:
Protein with the highest isoelectric point:
>tr|A0A2Y9AEU9|A0A2Y9AEU9_9MICO Protease HtpX homolog OS=Georgenia satyanarayanai OX=860221 GN=htpX PE=3 SV=1
MM1 pKa = 7.4GSVIKK6 pKa = 10.38KK7 pKa = 8.42RR8 pKa = 11.84RR9 pKa = 11.84KK10 pKa = 9.06RR11 pKa = 11.84MSKK14 pKa = 9.76KK15 pKa = 9.54KK16 pKa = 9.79HH17 pKa = 5.67RR18 pKa = 11.84KK19 pKa = 8.31LLRR22 pKa = 11.84KK23 pKa = 7.78TRR25 pKa = 11.84HH26 pKa = 3.65QRR28 pKa = 11.84RR29 pKa = 11.84NKK31 pKa = 9.78KK32 pKa = 9.85
MM1 pKa = 7.4GSVIKK6 pKa = 10.38KK7 pKa = 8.42RR8 pKa = 11.84RR9 pKa = 11.84KK10 pKa = 9.06RR11 pKa = 11.84MSKK14 pKa = 9.76KK15 pKa = 9.54KK16 pKa = 9.79HH17 pKa = 5.67RR18 pKa = 11.84KK19 pKa = 8.31LLRR22 pKa = 11.84KK23 pKa = 7.78TRR25 pKa = 11.84HH26 pKa = 3.65QRR28 pKa = 11.84RR29 pKa = 11.84NKK31 pKa = 9.78KK32 pKa = 9.85
Molecular weight: 4.1 kDa
Isoelectric point according different methods:
Peptides (in silico digests for buttom-up proteomics)
Below you can find in silico digests of the whole proteome with Trypsin, Chymotrypsin, Trypsin+LysC, LysN, ArgC proteases suitable for different mass spec machines.| Try ESI |
 |
|---|
| ChTry ESI |
 |
|---|
| ArgC ESI |
 |
|---|
| LysN ESI |
 |
|---|
| TryLysC ESI |
 |
|---|
| Try MALDI |
 |
|---|
| ChTry MALDI |
 |
|---|
| ArgC MALDI |
 |
|---|
| LysN MALDI |
 |
|---|
| TryLysC MALDI |
 |
|---|
| Try LTQ |
 |
|---|
| ChTry LTQ |
 |
|---|
| ArgC LTQ |
 |
|---|
| LysN LTQ |
 |
|---|
| TryLysC LTQ |
 |
|---|
| Try MSlow |
 |
|---|
| ChTry MSlow |
 |
|---|
| ArgC MSlow |
 |
|---|
| LysN MSlow |
 |
|---|
| TryLysC MSlow |
 |
|---|
| Try MShigh |
 |
|---|
| ChTry MShigh |
 |
|---|
| ArgC MShigh |
 |
|---|
| LysN MShigh |
 |
|---|
| TryLysC MShigh |
 |
|---|
General Statistics
Number of major isoforms |
Number of additional isoforms |
Number of all proteins |
Number of amino acids |
Min. Seq. Length |
Max. Seq. Length |
Avg. Seq. Length |
Avg. Mol. Weight |
|---|---|---|---|---|---|---|---|
0 |
1190508 |
24 |
2677 |
334.6 |
35.61 |
Amino acid frequency
Ala |
Cys |
Asp |
Glu |
Phe |
Gly |
His |
Ile |
Lys |
Leu |
|---|---|---|---|---|---|---|---|---|---|
13.781 ± 0.068 | 0.532 ± 0.01 |
6.256 ± 0.043 | 6.222 ± 0.042 |
2.48 ± 0.024 | 9.44 ± 0.035 |
2.113 ± 0.021 | 3.038 ± 0.032 |
1.329 ± 0.024 | 10.438 ± 0.055 |
Met |
Asn |
Gln |
Pro |
Arg |
Ser |
Thr |
Val |
Trp |
Tyr |
|---|---|---|---|---|---|---|---|---|---|
1.715 ± 0.016 | 1.598 ± 0.023 |
5.878 ± 0.039 | 2.733 ± 0.021 |
7.752 ± 0.051 | 4.947 ± 0.026 |
6.45 ± 0.034 | 9.93 ± 0.042 |
1.497 ± 0.016 | 1.872 ± 0.02 |
Most of the basic statistics you can see at this page can be downloaded from this CSV file
Proteome-pI is available under Creative Commons Attribution-NoDerivs license, for more details see here
| Reference: Kozlowski LP. Proteome-pI 2.0: Proteome Isoelectric Point Database Update. Nucleic Acids Res. 2021, doi: 10.1093/nar/gkab944 | Contact: Lukasz P. Kozlowski |
