Mannheimia phage vB_MhS_535AP2
Taxonomy: Viruses; Duplodnaviria; Heunggongvirae; Uroviricota; Caudoviricetes; Caudovirales; Siphoviridae; unclassified Siphoviridae
Average proteome isoelectric point is 6.54
Get precalculated fractions of proteins

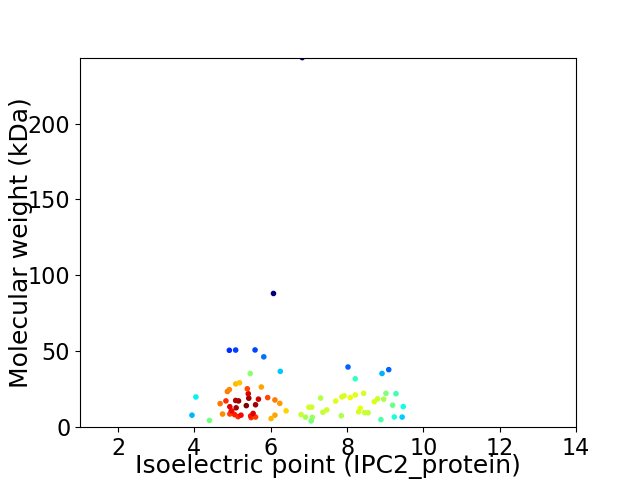
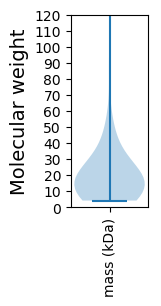
Virtual 2D-PAGE plot for 79 proteins (isoelectric point calculated using IPC2_protein)
Get csv file with sequences according to given criteria:
* You can choose from 21 different methods for calculating isoelectric point
Summary statistics related to proteome-wise predictions


Protein with the lowest isoelectric point:
>tr|A0A0M3LSX4|A0A0M3LSX4_9CAUD Uncharacterized protein OS=Mannheimia phage vB_MhS_535AP2 OX=1572743 GN=535AP2_50 PE=4 SV=1
MM1 pKa = 7.68NEE3 pKa = 3.68EE4 pKa = 4.84KK5 pKa = 10.81YY6 pKa = 11.02FSVDD10 pKa = 2.99VSDD13 pKa = 3.64EE14 pKa = 4.11THH16 pKa = 6.84VIRR19 pKa = 11.84LHH21 pKa = 5.55EE22 pKa = 4.34TLEE25 pKa = 4.09QAKK28 pKa = 9.83QSCLNGATEE37 pKa = 4.64AYY39 pKa = 9.52EE40 pKa = 4.2FAGDD44 pKa = 3.78MDD46 pKa = 3.97DD47 pKa = 4.09HH48 pKa = 6.86EE49 pKa = 5.61SYY51 pKa = 11.0EE52 pKa = 4.33SYY54 pKa = 10.55EE55 pKa = 4.7AYY57 pKa = 10.33DD58 pKa = 3.71LPYY61 pKa = 10.7AVYY64 pKa = 10.22GVVLGRR70 pKa = 11.84AKK72 pKa = 10.72SDD74 pKa = 3.03IRR76 pKa = 11.84PLTDD80 pKa = 2.99EE81 pKa = 4.38EE82 pKa = 4.39RR83 pKa = 11.84ASEE86 pKa = 4.11LFGEE90 pKa = 4.72AEE92 pKa = 4.12QVIEE96 pKa = 4.72PPTLLEE102 pKa = 4.12NNGWISIEE110 pKa = 4.33DD111 pKa = 3.78KK112 pKa = 10.91LPPIEE117 pKa = 4.18TDD119 pKa = 3.54VLGLCDD125 pKa = 3.61ISGMQLILIVSRR137 pKa = 11.84EE138 pKa = 3.88LADD141 pKa = 3.7NEE143 pKa = 4.5WYY145 pKa = 10.22FLSVNQYY152 pKa = 11.14GLDD155 pKa = 3.77DD156 pKa = 4.54DD157 pKa = 5.49VIAVTHH163 pKa = 6.15WQPLPEE169 pKa = 4.46PPKK172 pKa = 10.36EE173 pKa = 4.13EE174 pKa = 4.18KK175 pKa = 10.71
MM1 pKa = 7.68NEE3 pKa = 3.68EE4 pKa = 4.84KK5 pKa = 10.81YY6 pKa = 11.02FSVDD10 pKa = 2.99VSDD13 pKa = 3.64EE14 pKa = 4.11THH16 pKa = 6.84VIRR19 pKa = 11.84LHH21 pKa = 5.55EE22 pKa = 4.34TLEE25 pKa = 4.09QAKK28 pKa = 9.83QSCLNGATEE37 pKa = 4.64AYY39 pKa = 9.52EE40 pKa = 4.2FAGDD44 pKa = 3.78MDD46 pKa = 3.97DD47 pKa = 4.09HH48 pKa = 6.86EE49 pKa = 5.61SYY51 pKa = 11.0EE52 pKa = 4.33SYY54 pKa = 10.55EE55 pKa = 4.7AYY57 pKa = 10.33DD58 pKa = 3.71LPYY61 pKa = 10.7AVYY64 pKa = 10.22GVVLGRR70 pKa = 11.84AKK72 pKa = 10.72SDD74 pKa = 3.03IRR76 pKa = 11.84PLTDD80 pKa = 2.99EE81 pKa = 4.38EE82 pKa = 4.39RR83 pKa = 11.84ASEE86 pKa = 4.11LFGEE90 pKa = 4.72AEE92 pKa = 4.12QVIEE96 pKa = 4.72PPTLLEE102 pKa = 4.12NNGWISIEE110 pKa = 4.33DD111 pKa = 3.78KK112 pKa = 10.91LPPIEE117 pKa = 4.18TDD119 pKa = 3.54VLGLCDD125 pKa = 3.61ISGMQLILIVSRR137 pKa = 11.84EE138 pKa = 3.88LADD141 pKa = 3.7NEE143 pKa = 4.5WYY145 pKa = 10.22FLSVNQYY152 pKa = 11.14GLDD155 pKa = 3.77DD156 pKa = 4.54DD157 pKa = 5.49VIAVTHH163 pKa = 6.15WQPLPEE169 pKa = 4.46PPKK172 pKa = 10.36EE173 pKa = 4.13EE174 pKa = 4.18KK175 pKa = 10.71
Molecular weight: 19.9 kDa
Isoelectric point according different methods:
Protein with the highest isoelectric point:
>tr|A0A0M3LSJ6|A0A0M3LSJ6_9CAUD Uncharacterized protein OS=Mannheimia phage vB_MhS_535AP2 OX=1572743 GN=535AP2_09 PE=4 SV=1
MM1 pKa = 7.45GNKK4 pKa = 8.25KK5 pKa = 8.69TSNTANVRR13 pKa = 11.84GFVLYY18 pKa = 10.27KK19 pKa = 9.96SHH21 pKa = 7.12HH22 pKa = 6.41LGISSVFYY30 pKa = 7.79PTNPEE35 pKa = 4.05TIAKK39 pKa = 9.24LCNIYY44 pKa = 10.32FPSKK48 pKa = 10.74QKK50 pKa = 10.53GSCYY54 pKa = 10.73APIFNSGG61 pKa = 2.84
MM1 pKa = 7.45GNKK4 pKa = 8.25KK5 pKa = 8.69TSNTANVRR13 pKa = 11.84GFVLYY18 pKa = 10.27KK19 pKa = 9.96SHH21 pKa = 7.12HH22 pKa = 6.41LGISSVFYY30 pKa = 7.79PTNPEE35 pKa = 4.05TIAKK39 pKa = 9.24LCNIYY44 pKa = 10.32FPSKK48 pKa = 10.74QKK50 pKa = 10.53GSCYY54 pKa = 10.73APIFNSGG61 pKa = 2.84
Molecular weight: 6.73 kDa
Isoelectric point according different methods:
Peptides (in silico digests for buttom-up proteomics)
Below you can find in silico digests of the whole proteome with Trypsin, Chymotrypsin, Trypsin+LysC, LysN, ArgC proteases suitable for different mass spec machines.| Try ESI |
 |
|---|
| ChTry ESI |
 |
|---|
| ArgC ESI |
 |
|---|
| LysN ESI |
 |
|---|
| TryLysC ESI |
 |
|---|
| Try MALDI |
 |
|---|
| ChTry MALDI |
 |
|---|
| ArgC MALDI |
 |
|---|
| LysN MALDI |
 |
|---|
| TryLysC MALDI |
 |
|---|
| Try LTQ |
 |
|---|
| ChTry LTQ |
 |
|---|
| ArgC LTQ |
 |
|---|
| LysN LTQ |
 |
|---|
| TryLysC LTQ |
 |
|---|
| Try MSlow |
 |
|---|
| ChTry MSlow |
 |
|---|
| ArgC MSlow |
 |
|---|
| LysN MSlow |
 |
|---|
| TryLysC MSlow |
 |
|---|
| Try MShigh |
 |
|---|
| ChTry MShigh |
 |
|---|
| ArgC MShigh |
 |
|---|
| LysN MShigh |
 |
|---|
| TryLysC MShigh |
 |
|---|
General Statistics
Number of major isoforms |
Number of additional isoforms |
Number of all proteins |
Number of amino acids |
Min. Seq. Length |
Max. Seq. Length |
Avg. Seq. Length |
Avg. Mol. Weight |
|---|---|---|---|---|---|---|---|
0 |
15084 |
38 |
2241 |
190.9 |
21.46 |
Amino acid frequency
Ala |
Cys |
Asp |
Glu |
Phe |
Gly |
His |
Ile |
Lys |
Leu |
|---|---|---|---|---|---|---|---|---|---|
8.174 ± 0.624 | 1.008 ± 0.189 |
5.237 ± 0.196 | 7.2 ± 0.403 |
3.812 ± 0.259 | 6.358 ± 0.267 |
1.604 ± 0.157 | 7.001 ± 0.214 |
7.246 ± 0.391 | 8.307 ± 0.287 |
Met |
Asn |
Gln |
Pro |
Arg |
Ser |
Thr |
Val |
Trp |
Tyr |
|---|---|---|---|---|---|---|---|---|---|
2.234 ± 0.213 | 5.841 ± 0.327 |
3.116 ± 0.227 | 4.946 ± 0.27 |
4.879 ± 0.228 | 6.431 ± 0.29 |
5.88 ± 0.603 | 5.993 ± 0.238 |
1.352 ± 0.118 | 3.381 ± 0.191 |
Most of the basic statistics you can see at this page can be downloaded from this CSV file
Proteome-pI is available under Creative Commons Attribution-NoDerivs license, for more details see here
| Reference: Kozlowski LP. Proteome-pI 2.0: Proteome Isoelectric Point Database Update. Nucleic Acids Res. 2021, doi: 10.1093/nar/gkab944 | Contact: Lukasz P. Kozlowski |
