Gemmobacter caeni
Taxonomy: cellular organisms; Bacteria; Proteobacteria; Alphaproteobacteria; Rhodobacterales; Rhodobacteraceae; Gemmobacter
Average proteome isoelectric point is 6.44
Get precalculated fractions of proteins
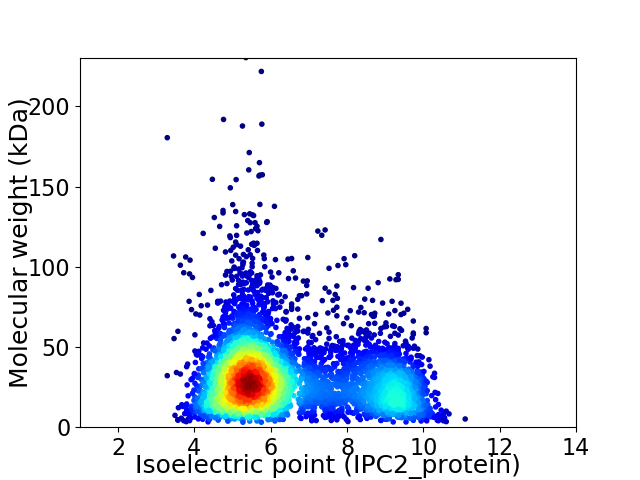
Virtual 2D-PAGE plot for 5113 proteins (isoelectric point calculated using IPC2_protein)
Get csv file with sequences according to given criteria:
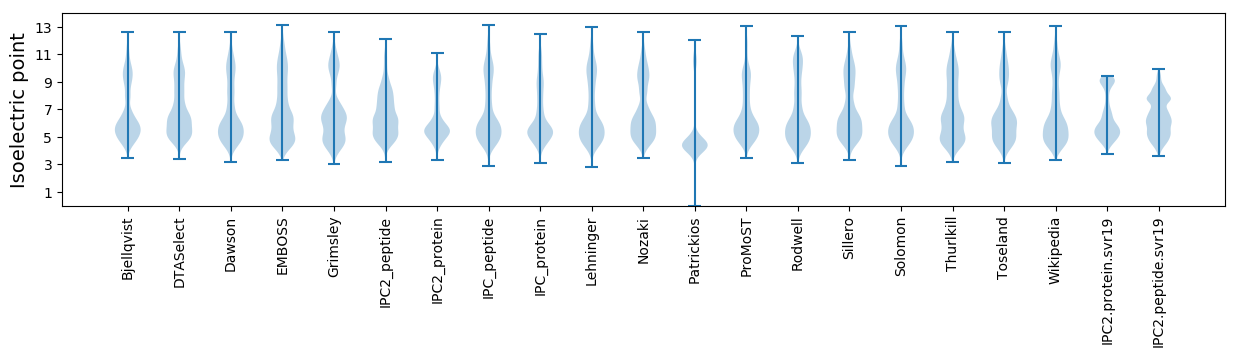
* You can choose from 21 different methods for calculating isoelectric point
Summary statistics related to proteome-wise predictions
Protein with the lowest isoelectric point:
>tr|A0A2T6B3A6|A0A2T6B3A6_9RHOB Threonylcarbamoyladenosine tRNA methylthiotransferase MtaB OS=Gemmobacter caeni OX=589035 GN=C8N34_105185 PE=4 SV=1
MM1 pKa = 7.65RR2 pKa = 11.84FSLVCLALAGTTLPAAAEE20 pKa = 4.22SLSFTLSNQSNADD33 pKa = 3.18LTEE36 pKa = 5.45FYY38 pKa = 10.53ASPVGTEE45 pKa = 3.53SWEE48 pKa = 4.0EE49 pKa = 4.05NILSTGALPAGASGDD64 pKa = 3.5ITIAEE69 pKa = 4.33AKK71 pKa = 9.23GCEE74 pKa = 3.87YY75 pKa = 10.87DD76 pKa = 3.53FRR78 pKa = 11.84MVFADD83 pKa = 3.85GDD85 pKa = 4.05VLEE88 pKa = 5.25DD89 pKa = 3.97RR90 pKa = 11.84SNICDD95 pKa = 3.16SGAYY99 pKa = 8.66TIQQ102 pKa = 3.33
MM1 pKa = 7.65RR2 pKa = 11.84FSLVCLALAGTTLPAAAEE20 pKa = 4.22SLSFTLSNQSNADD33 pKa = 3.18LTEE36 pKa = 5.45FYY38 pKa = 10.53ASPVGTEE45 pKa = 3.53SWEE48 pKa = 4.0EE49 pKa = 4.05NILSTGALPAGASGDD64 pKa = 3.5ITIAEE69 pKa = 4.33AKK71 pKa = 9.23GCEE74 pKa = 3.87YY75 pKa = 10.87DD76 pKa = 3.53FRR78 pKa = 11.84MVFADD83 pKa = 3.85GDD85 pKa = 4.05VLEE88 pKa = 5.25DD89 pKa = 3.97RR90 pKa = 11.84SNICDD95 pKa = 3.16SGAYY99 pKa = 8.66TIQQ102 pKa = 3.33
Molecular weight: 10.75 kDa
Isoelectric point according different methods:
Protein with the highest isoelectric point:
>tr|A0A2T6B6B0|A0A2T6B6B0_9RHOB Beta-methylmalyl-CoA/L-malyl-CoA lyase OS=Gemmobacter caeni OX=589035 GN=C8N34_10374 PE=3 SV=1
MM1 pKa = 7.35KK2 pKa = 9.44RR3 pKa = 11.84TYY5 pKa = 10.31QPSNLVRR12 pKa = 11.84KK13 pKa = 9.18RR14 pKa = 11.84RR15 pKa = 11.84HH16 pKa = 4.42GFRR19 pKa = 11.84ARR21 pKa = 11.84MATKK25 pKa = 10.39GGRR28 pKa = 11.84LVLNARR34 pKa = 11.84RR35 pKa = 11.84AKK37 pKa = 10.06GRR39 pKa = 11.84KK40 pKa = 8.83KK41 pKa = 10.63LSAA44 pKa = 3.95
MM1 pKa = 7.35KK2 pKa = 9.44RR3 pKa = 11.84TYY5 pKa = 10.31QPSNLVRR12 pKa = 11.84KK13 pKa = 9.18RR14 pKa = 11.84RR15 pKa = 11.84HH16 pKa = 4.42GFRR19 pKa = 11.84ARR21 pKa = 11.84MATKK25 pKa = 10.39GGRR28 pKa = 11.84LVLNARR34 pKa = 11.84RR35 pKa = 11.84AKK37 pKa = 10.06GRR39 pKa = 11.84KK40 pKa = 8.83KK41 pKa = 10.63LSAA44 pKa = 3.95
Molecular weight: 5.12 kDa
Isoelectric point according different methods:
Peptides (in silico digests for buttom-up proteomics)
Below you can find in silico digests of the whole proteome with Trypsin, Chymotrypsin, Trypsin+LysC, LysN, ArgC proteases suitable for different mass spec machines.| Try ESI |
 |
|---|
| ChTry ESI |
|
|---|
| ArgC ESI |
|
|---|
| LysN ESI |
|
|---|
| TryLysC ESI |
|
|---|
| Try MALDI |
|
|---|
| ChTry MALDI |
|
|---|
| ArgC MALDI |
|
|---|
| LysN MALDI |
|
|---|
| TryLysC MALDI |
|
|---|
| Try LTQ |
|
|---|
| ChTry LTQ |
|
|---|
| ArgC LTQ |
|
|---|
| LysN LTQ |
|
|---|
| TryLysC LTQ |
|
|---|
| Try MSlow |
|
|---|
| ChTry MSlow |
|
|---|
| ArgC MSlow |
|
|---|
| LysN MSlow |
|
|---|
| TryLysC MSlow |
|
|---|
| Try MShigh |
|
|---|
| ChTry MShigh |
|
|---|
| ArgC MShigh |
|
|---|
| LysN MShigh |
|
|---|
| TryLysC MShigh |
|
|---|
General Statistics
Number of major isoforms |
Number of additional isoforms |
Number of all proteins |
Number of amino acids |
Min. Seq. Length |
Max. Seq. Length |
Avg. Seq. Length |
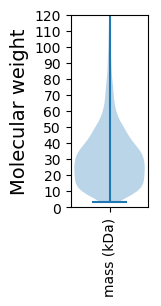
Avg. Mol. Weight |
|---|---|---|---|---|---|---|---|
0 |
1552672 |
29 |
2131 |
303.7 |
32.82 |
Amino acid frequency
Ala |
Cys |
Asp |
Glu |
Phe |
Gly |
His |
Ile |
Lys |
Leu |
|---|---|---|---|---|---|---|---|---|---|
13.256 ± 0.052 | 0.89 ± 0.012 |
5.715 ± 0.031 | 5.749 ± 0.035 |
3.531 ± 0.02 | 9.02 ± 0.042 |
2.01 ± 0.017 | 4.752 ± 0.023 |
2.781 ± 0.026 | 10.426 ± 0.048 |
Met |
Asn |
Gln |
Pro |
Arg |
Ser |
Thr |
Val |
Trp |
Tyr |
|---|---|---|---|---|---|---|---|---|---|
2.694 ± 0.018 | 2.312 ± 0.019 |
5.457 ± 0.029 | 3.055 ± 0.02 |
7.433 ± 0.038 | 4.86 ± 0.026 |
5.389 ± 0.028 | 7.179 ± 0.03 |
1.454 ± 0.017 | 2.037 ± 0.015 |
Most of the basic statistics you can see at this page can be downloaded from this CSV file
See this proteome in:

Proteome-pI is available under Creative Commons Attribution-NoDerivs license, for more details see here
| Reference: Kozlowski LP. Proteome-pI 2.0: Proteome Isoelectric Point Database Update. Nucleic Acids Res. 2021, doi: 10.1093/nar/gkab944 | Contact: Lukasz P. Kozlowski |