Paracoccus sulfuroxidans
Taxonomy: cellular organisms; Bacteria; Proteobacteria; Alphaproteobacteria; Rhodobacterales; Rhodobacteraceae; Paracoccus
Average proteome isoelectric point is 6.28
Get precalculated fractions of proteins

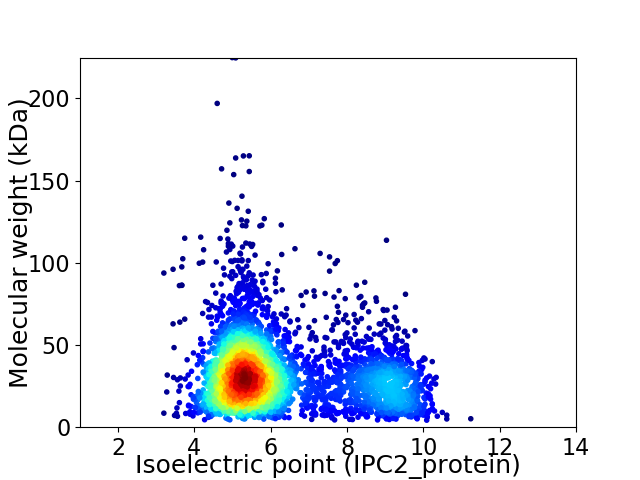
Virtual 2D-PAGE plot for 3917 proteins (isoelectric point calculated using IPC2_protein)
Get csv file with sequences according to given criteria:
* You can choose from 21 different methods for calculating isoelectric point
Summary statistics related to proteome-wise predictions


Protein with the lowest isoelectric point:
>tr|A0A562NMA5|A0A562NMA5_9RHOB 16S rRNA (Guanine1207-N2)-methyltransferase OS=Paracoccus sulfuroxidans OX=384678 GN=IQ24_02755 PE=4 SV=1
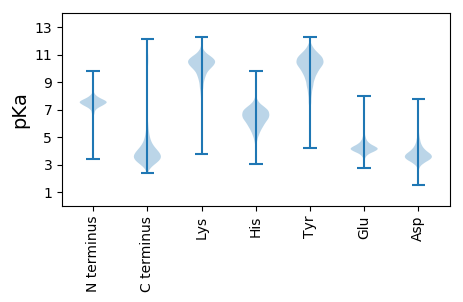
MM1 pKa = 7.01TVSRR5 pKa = 11.84LNTGFTTTGAISYY18 pKa = 9.87LGEE21 pKa = 4.12SDD23 pKa = 3.86TYY25 pKa = 10.6NTTFIQGLTYY35 pKa = 9.95SVRR38 pKa = 11.84VSGASSGGGSLADD51 pKa = 4.28PNLGLYY57 pKa = 7.59NTAGQRR63 pKa = 11.84LLFNDD68 pKa = 5.33DD69 pKa = 3.28INPGVNRR76 pKa = 11.84DD77 pKa = 3.34SALTFTVNQTSDD89 pKa = 2.96YY90 pKa = 10.4RR91 pKa = 11.84MLVGEE96 pKa = 4.4QGNNATGSYY105 pKa = 9.42TIAISAGYY113 pKa = 10.33ANNNNNTVYY122 pKa = 9.36GTYY125 pKa = 10.51NADD128 pKa = 3.36AVNGMGGNDD137 pKa = 3.66ILNGGAGNDD146 pKa = 3.92RR147 pKa = 11.84LWGGTGNDD155 pKa = 3.25QLLGGLHH162 pKa = 7.03NDD164 pKa = 4.16TLWGEE169 pKa = 4.08QGNDD173 pKa = 3.17VLRR176 pKa = 11.84GGEE179 pKa = 4.25GNDD182 pKa = 3.53ALVGGAGADD191 pKa = 3.57RR192 pKa = 11.84LIGGNGADD200 pKa = 2.37RR201 pKa = 11.84FVFNFASDD209 pKa = 3.9SARR212 pKa = 11.84GAPDD216 pKa = 4.42TIAMGDD222 pKa = 3.72GAIAMQGVGVAGGDD236 pKa = 3.78VIDD239 pKa = 5.8LSGIDD244 pKa = 3.93ANVNYY249 pKa = 10.38AGNQAFTWSTSHH261 pKa = 7.47AAGTLSLSEE270 pKa = 4.28QNGSTVVQGHH280 pKa = 5.45VNNDD284 pKa = 3.95GIADD288 pKa = 4.58FVLVIADD295 pKa = 3.7GAGINAFSYY304 pKa = 9.96TSNEE308 pKa = 3.84FVLL311 pKa = 4.62
MM1 pKa = 7.01TVSRR5 pKa = 11.84LNTGFTTTGAISYY18 pKa = 9.87LGEE21 pKa = 4.12SDD23 pKa = 3.86TYY25 pKa = 10.6NTTFIQGLTYY35 pKa = 9.95SVRR38 pKa = 11.84VSGASSGGGSLADD51 pKa = 4.28PNLGLYY57 pKa = 7.59NTAGQRR63 pKa = 11.84LLFNDD68 pKa = 5.33DD69 pKa = 3.28INPGVNRR76 pKa = 11.84DD77 pKa = 3.34SALTFTVNQTSDD89 pKa = 2.96YY90 pKa = 10.4RR91 pKa = 11.84MLVGEE96 pKa = 4.4QGNNATGSYY105 pKa = 9.42TIAISAGYY113 pKa = 10.33ANNNNNTVYY122 pKa = 9.36GTYY125 pKa = 10.51NADD128 pKa = 3.36AVNGMGGNDD137 pKa = 3.66ILNGGAGNDD146 pKa = 3.92RR147 pKa = 11.84LWGGTGNDD155 pKa = 3.25QLLGGLHH162 pKa = 7.03NDD164 pKa = 4.16TLWGEE169 pKa = 4.08QGNDD173 pKa = 3.17VLRR176 pKa = 11.84GGEE179 pKa = 4.25GNDD182 pKa = 3.53ALVGGAGADD191 pKa = 3.57RR192 pKa = 11.84LIGGNGADD200 pKa = 2.37RR201 pKa = 11.84FVFNFASDD209 pKa = 3.9SARR212 pKa = 11.84GAPDD216 pKa = 4.42TIAMGDD222 pKa = 3.72GAIAMQGVGVAGGDD236 pKa = 3.78VIDD239 pKa = 5.8LSGIDD244 pKa = 3.93ANVNYY249 pKa = 10.38AGNQAFTWSTSHH261 pKa = 7.47AAGTLSLSEE270 pKa = 4.28QNGSTVVQGHH280 pKa = 5.45VNNDD284 pKa = 3.95GIADD288 pKa = 4.58FVLVIADD295 pKa = 3.7GAGINAFSYY304 pKa = 9.96TSNEE308 pKa = 3.84FVLL311 pKa = 4.62
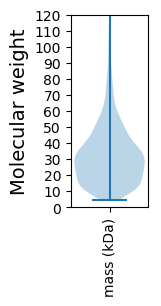
Molecular weight: 31.73 kDa
Isoelectric point according different methods:
Protein with the highest isoelectric point:
>tr|A0A562NX08|A0A562NX08_9RHOB Microcin C transport system permease protein OS=Paracoccus sulfuroxidans OX=384678 GN=IQ24_00526 PE=3 SV=1
MM1 pKa = 7.69SKK3 pKa = 9.01RR4 pKa = 11.84TFQPSNLVRR13 pKa = 11.84ARR15 pKa = 11.84RR16 pKa = 11.84HH17 pKa = 4.37GFRR20 pKa = 11.84ARR22 pKa = 11.84MATKK26 pKa = 10.12GGRR29 pKa = 11.84RR30 pKa = 11.84VLNARR35 pKa = 11.84RR36 pKa = 11.84AKK38 pKa = 10.0GRR40 pKa = 11.84KK41 pKa = 8.91SLSAA45 pKa = 3.86
MM1 pKa = 7.69SKK3 pKa = 9.01RR4 pKa = 11.84TFQPSNLVRR13 pKa = 11.84ARR15 pKa = 11.84RR16 pKa = 11.84HH17 pKa = 4.37GFRR20 pKa = 11.84ARR22 pKa = 11.84MATKK26 pKa = 10.12GGRR29 pKa = 11.84RR30 pKa = 11.84VLNARR35 pKa = 11.84RR36 pKa = 11.84AKK38 pKa = 10.0GRR40 pKa = 11.84KK41 pKa = 8.91SLSAA45 pKa = 3.86
Molecular weight: 5.14 kDa
Isoelectric point according different methods:
Peptides (in silico digests for buttom-up proteomics)
Below you can find in silico digests of the whole proteome with Trypsin, Chymotrypsin, Trypsin+LysC, LysN, ArgC proteases suitable for different mass spec machines.| Try ESI |
 |
|---|
| ChTry ESI |
 |
|---|
| ArgC ESI |
 |
|---|
| LysN ESI |
 |
|---|
| TryLysC ESI |
 |
|---|
| Try MALDI |
 |
|---|
| ChTry MALDI |
 |
|---|
| ArgC MALDI |
 |
|---|
| LysN MALDI |
 |
|---|
| TryLysC MALDI |
 |
|---|
| Try LTQ |
 |
|---|
| ChTry LTQ |
 |
|---|
| ArgC LTQ |
 |
|---|
| LysN LTQ |
 |
|---|
| TryLysC LTQ |
 |
|---|
| Try MSlow |
 |
|---|
| ChTry MSlow |
 |
|---|
| ArgC MSlow |
 |
|---|
| LysN MSlow |
 |
|---|
| TryLysC MSlow |
 |
|---|
| Try MShigh |
 |
|---|
| ChTry MShigh |
 |
|---|
| ArgC MShigh |
 |
|---|
| LysN MShigh |
 |
|---|
| TryLysC MShigh |
 |
|---|
General Statistics
Number of major isoforms |
Number of additional isoforms |
Number of all proteins |
Number of amino acids |
Min. Seq. Length |
Max. Seq. Length |
Avg. Seq. Length |
Avg. Mol. Weight |
|---|---|---|---|---|---|---|---|
0 |
1217529 |
39 |
2200 |
310.8 |
33.7 |
Amino acid frequency
Ala |
Cys |
Asp |
Glu |
Phe |
Gly |
His |
Ile |
Lys |
Leu |
|---|---|---|---|---|---|---|---|---|---|
12.458 ± 0.049 | 0.785 ± 0.013 |
5.888 ± 0.037 | 5.728 ± 0.037 |
3.527 ± 0.023 | 8.82 ± 0.051 |
1.995 ± 0.019 | 5.265 ± 0.024 |
2.909 ± 0.034 | 10.206 ± 0.054 |
Met |
Asn |
Gln |
Pro |
Arg |
Ser |
Thr |
Val |
Trp |
Tyr |
|---|---|---|---|---|---|---|---|---|---|
2.792 ± 0.018 | 2.643 ± 0.03 |
5.37 ± 0.033 | 3.528 ± 0.025 |
7.044 ± 0.043 | 5.203 ± 0.027 |
5.326 ± 0.031 | 6.992 ± 0.031 |
1.429 ± 0.019 | 2.092 ± 0.019 |
Most of the basic statistics you can see at this page can be downloaded from this CSV file
Proteome-pI is available under Creative Commons Attribution-NoDerivs license, for more details see here
| Reference: Kozlowski LP. Proteome-pI 2.0: Proteome Isoelectric Point Database Update. Nucleic Acids Res. 2021, doi: 10.1093/nar/gkab944 | Contact: Lukasz P. Kozlowski |
