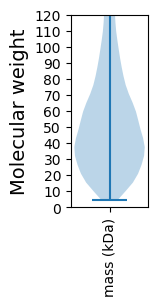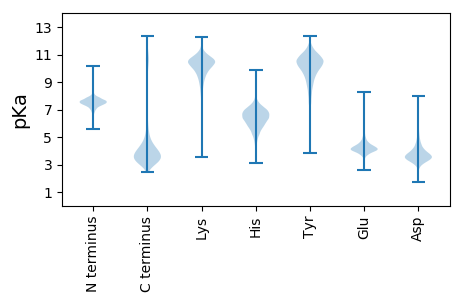
Kwoniella shandongensis
Taxonomy: cellular organisms; Eukaryota; Opisthokonta; Fungi; Dikarya; Basidiomycota; Agaricomycotina; Tremellomycetes; Tremellales; Cryptococcaceae; Kwoniella
Average proteome isoelectric point is 6.48
Get precalculated fractions of proteins

Virtual 2D-PAGE plot for 7422 proteins (isoelectric point calculated using IPC2_protein)
Get csv file with sequences according to given criteria:
* You can choose from 21 different methods for calculating isoelectric point
Summary statistics related to proteome-wise predictions


Protein with the lowest isoelectric point:
>tr|A0A5M6BS84|A0A5M6BS84_9TREE Uncharacterized protein OS=Kwoniella shandongensis OX=1734106 GN=CI109_007192 PE=4 SV=1
MM1 pKa = 7.3FSKK4 pKa = 10.59FALVTLTAIIGAGVGVTAAPFTKK27 pKa = 9.8RR28 pKa = 11.84DD29 pKa = 3.94TNVLLYY35 pKa = 10.03SQKK38 pKa = 11.39DD39 pKa = 3.71NLCLSVEE46 pKa = 4.42TGAQANDD53 pKa = 3.14QTQAYY58 pKa = 8.87SNHH61 pKa = 5.97SSPYY65 pKa = 8.43LYY67 pKa = 10.36EE68 pKa = 4.03GLRR71 pKa = 11.84VVSLPCEE78 pKa = 4.24NSSTWDD84 pKa = 3.37VSQGNGSVYY93 pKa = 9.13VTNSDD98 pKa = 3.24QAFALEE104 pKa = 4.67AGPHH108 pKa = 5.49VDD110 pKa = 3.59NFQTLWVNKK119 pKa = 8.22TYY121 pKa = 10.06PGKK124 pKa = 10.06YY125 pKa = 9.04SQTFFYY131 pKa = 10.57TGDD134 pKa = 3.23RR135 pKa = 11.84RR136 pKa = 11.84LAVTNSTEE144 pKa = 4.55CVDD147 pKa = 3.9EE148 pKa = 4.63GDD150 pKa = 4.42NGAQEE155 pKa = 4.38YY156 pKa = 10.71SCTTGDD162 pKa = 3.89TNQIWDD168 pKa = 3.76ATSPNGPLDD177 pKa = 4.18PQPLTTFASSVSTAAATASPASASSDD203 pKa = 3.45VTSASSGDD211 pKa = 3.91DD212 pKa = 3.49PSTATADD219 pKa = 3.66ATSVTAAGATASTGSSPTDD238 pKa = 3.38NASGSSDD245 pKa = 2.63IAAAATTSPSDD256 pKa = 3.38TASAATASADD266 pKa = 3.27ITRR269 pKa = 11.84LASSPSSDD277 pKa = 3.05VAAAATASPAFTAATFALGGEE298 pKa = 4.71PEE300 pKa = 4.65SSTAPASAASDD311 pKa = 3.61SASASSCKK319 pKa = 10.02RR320 pKa = 11.84SGANN324 pKa = 3.14
MM1 pKa = 7.3FSKK4 pKa = 10.59FALVTLTAIIGAGVGVTAAPFTKK27 pKa = 9.8RR28 pKa = 11.84DD29 pKa = 3.94TNVLLYY35 pKa = 10.03SQKK38 pKa = 11.39DD39 pKa = 3.71NLCLSVEE46 pKa = 4.42TGAQANDD53 pKa = 3.14QTQAYY58 pKa = 8.87SNHH61 pKa = 5.97SSPYY65 pKa = 8.43LYY67 pKa = 10.36EE68 pKa = 4.03GLRR71 pKa = 11.84VVSLPCEE78 pKa = 4.24NSSTWDD84 pKa = 3.37VSQGNGSVYY93 pKa = 9.13VTNSDD98 pKa = 3.24QAFALEE104 pKa = 4.67AGPHH108 pKa = 5.49VDD110 pKa = 3.59NFQTLWVNKK119 pKa = 8.22TYY121 pKa = 10.06PGKK124 pKa = 10.06YY125 pKa = 9.04SQTFFYY131 pKa = 10.57TGDD134 pKa = 3.23RR135 pKa = 11.84RR136 pKa = 11.84LAVTNSTEE144 pKa = 4.55CVDD147 pKa = 3.9EE148 pKa = 4.63GDD150 pKa = 4.42NGAQEE155 pKa = 4.38YY156 pKa = 10.71SCTTGDD162 pKa = 3.89TNQIWDD168 pKa = 3.76ATSPNGPLDD177 pKa = 4.18PQPLTTFASSVSTAAATASPASASSDD203 pKa = 3.45VTSASSGDD211 pKa = 3.91DD212 pKa = 3.49PSTATADD219 pKa = 3.66ATSVTAAGATASTGSSPTDD238 pKa = 3.38NASGSSDD245 pKa = 2.63IAAAATTSPSDD256 pKa = 3.38TASAATASADD266 pKa = 3.27ITRR269 pKa = 11.84LASSPSSDD277 pKa = 3.05VAAAATASPAFTAATFALGGEE298 pKa = 4.71PEE300 pKa = 4.65SSTAPASAASDD311 pKa = 3.61SASASSCKK319 pKa = 10.02RR320 pKa = 11.84SGANN324 pKa = 3.14
Molecular weight: 32.52 kDa
Isoelectric point according different methods:
Protein with the highest isoelectric point:
>tr|A0A5M6BWC3|A0A5M6BWC3_9TREE L51_S25_CI-B8 domain-containing protein OS=Kwoniella shandongensis OX=1734106 GN=CI109_004470 PE=4 SV=1
MM1 pKa = 7.5PRR3 pKa = 11.84LPRR6 pKa = 11.84TAFLRR11 pKa = 11.84SLPLPPLQPRR21 pKa = 11.84LALPSVSRR29 pKa = 11.84TTLTPSTFTSSFASLRR45 pKa = 11.84LSPLNSSLITSSLRR59 pKa = 11.84PSISNLPTHH68 pKa = 6.83ILSSSSTSQIQLGGVRR84 pKa = 11.84GAAMGTFYY92 pKa = 10.92QPSQRR97 pKa = 11.84KK98 pKa = 8.72RR99 pKa = 11.84KK100 pKa = 8.95NKK102 pKa = 9.88HH103 pKa = 4.66GFLARR108 pKa = 11.84LRR110 pKa = 11.84GGKK113 pKa = 7.91NARR116 pKa = 11.84KK117 pKa = 8.1MLSRR121 pKa = 11.84RR122 pKa = 11.84LLKK125 pKa = 10.3GRR127 pKa = 11.84KK128 pKa = 8.56NLSHH132 pKa = 7.01
MM1 pKa = 7.5PRR3 pKa = 11.84LPRR6 pKa = 11.84TAFLRR11 pKa = 11.84SLPLPPLQPRR21 pKa = 11.84LALPSVSRR29 pKa = 11.84TTLTPSTFTSSFASLRR45 pKa = 11.84LSPLNSSLITSSLRR59 pKa = 11.84PSISNLPTHH68 pKa = 6.83ILSSSSTSQIQLGGVRR84 pKa = 11.84GAAMGTFYY92 pKa = 10.92QPSQRR97 pKa = 11.84KK98 pKa = 8.72RR99 pKa = 11.84KK100 pKa = 8.95NKK102 pKa = 9.88HH103 pKa = 4.66GFLARR108 pKa = 11.84LRR110 pKa = 11.84GGKK113 pKa = 7.91NARR116 pKa = 11.84KK117 pKa = 8.1MLSRR121 pKa = 11.84RR122 pKa = 11.84LLKK125 pKa = 10.3GRR127 pKa = 11.84KK128 pKa = 8.56NLSHH132 pKa = 7.01
Molecular weight: 14.52 kDa
Isoelectric point according different methods:
Peptides (in silico digests for buttom-up proteomics)
Below you can find in silico digests of the whole proteome with Trypsin, Chymotrypsin, Trypsin+LysC, LysN, ArgC proteases suitable for different mass spec machines.| Try ESI |
 |
|---|
| ChTry ESI |
 |
|---|
| ArgC ESI |
 |
|---|
| LysN ESI |
 |
|---|
| TryLysC ESI |
 |
|---|
| Try MALDI |
 |
|---|
| ChTry MALDI |
 |
|---|
| ArgC MALDI |
 |
|---|
| LysN MALDI |
 |
|---|
| TryLysC MALDI |
 |
|---|
| Try LTQ |
 |
|---|
| ChTry LTQ |
 |
|---|
| ArgC LTQ |
 |
|---|
| LysN LTQ |
 |
|---|
| TryLysC LTQ |
 |
|---|
| Try MSlow |
 |
|---|
| ChTry MSlow |
 |
|---|
| ArgC MSlow |
 |
|---|
| LysN MSlow |
 |
|---|
| TryLysC MSlow |
 |
|---|
| Try MShigh |
 |
|---|
| ChTry MShigh |
 |
|---|
| ArgC MShigh |
 |
|---|
| LysN MShigh |
 |
|---|
| TryLysC MShigh |
 |
|---|
General Statistics
Number of major isoforms |
Number of additional isoforms |
Number of all proteins |
Number of amino acids |
Min. Seq. Length |
Max. Seq. Length |
Avg. Seq. Length |
Avg. Mol. Weight |
|---|---|---|---|---|---|---|---|
0 |
3956821 |
40 |
4986 |
533.1 |
58.38 |
Amino acid frequency
Ala |
Cys |
Asp |
Glu |
Phe |
Gly |
His |
Ile |
Lys |
Leu |
|---|---|---|---|---|---|---|---|---|---|
8.478 ± 0.026 | 0.911 ± 0.008 |
5.541 ± 0.021 | 6.405 ± 0.026 |
3.265 ± 0.017 | 7.519 ± 0.027 |
2.31 ± 0.013 | 4.609 ± 0.018 |
4.918 ± 0.024 | 8.724 ± 0.031 |
Met |
Asn |
Gln |
Pro |
Arg |
Ser |
Thr |
Val |
Trp |
Tyr |
|---|---|---|---|---|---|---|---|---|---|
2.043 ± 0.011 | 3.293 ± 0.013 |
6.793 ± 0.032 | 3.73 ± 0.023 |
6.026 ± 0.023 | 9.247 ± 0.041 |
6.299 ± 0.02 | 6.083 ± 0.019 |
1.351 ± 0.009 | 2.456 ± 0.015 |
Most of the basic statistics you can see at this page can be downloaded from this CSV file
Proteome-pI is available under Creative Commons Attribution-NoDerivs license, for more details see here
| Reference: Kozlowski LP. Proteome-pI 2.0: Proteome Isoelectric Point Database Update. Nucleic Acids Res. 2021, doi: 10.1093/nar/gkab944 | Contact: Lukasz P. Kozlowski |
