Desulfotomaculum nigrificans (strain DSM 14880 / VKM B-2319 / CO-1-SRB) (Desulfotomaculum carboxydivorans)
Taxonomy: cellular organisms; Bacteria; Terrabacteria group; Firmicutes; Clostridia; Eubacteriales; Peptococcaceae; Desulfotomaculum; Desulfotomaculum nigrificans
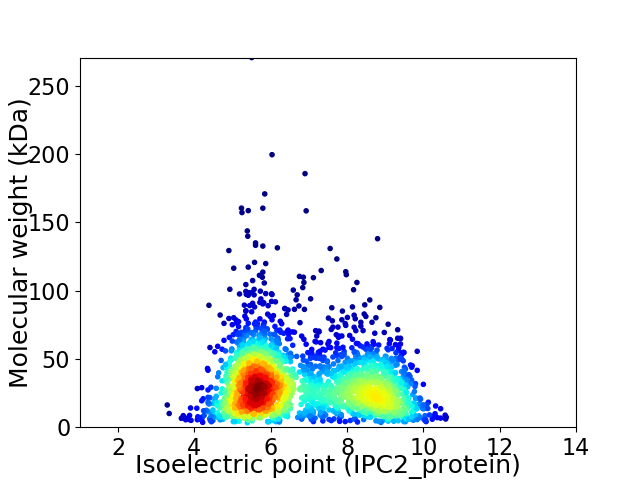
Average proteome isoelectric point is 6.8
Get precalculated fractions of proteins

Virtual 2D-PAGE plot for 2620 proteins (isoelectric point calculated using IPC2_protein)
Get csv file with sequences according to given criteria:
* You can choose from 21 different methods for calculating isoelectric point
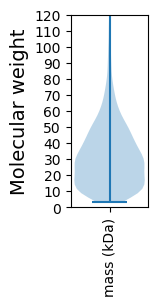
Summary statistics related to proteome-wise predictions


Protein with the lowest isoelectric point:
>tr|F6B4I8|F6B4I8_DESCC Spore cortex biosynthesis protein YabQ OS=Desulfotomaculum nigrificans (strain DSM 14880 / VKM B-2319 / CO-1-SRB) OX=868595 GN=Desca_0106 PE=4 SV=1
MM1 pKa = 7.52SNQEE5 pKa = 3.73EE6 pKa = 4.63GRR8 pKa = 11.84PDD10 pKa = 3.35MLEE13 pKa = 3.93TGVSSWSYY21 pKa = 10.32SPEE24 pKa = 4.12VPDD27 pKa = 4.35EE28 pKa = 4.03EE29 pKa = 4.73MNVDD33 pKa = 5.74FYY35 pKa = 11.54YY36 pKa = 10.79NWSAHH41 pKa = 4.32WW42 pKa = 3.71
MM1 pKa = 7.52SNQEE5 pKa = 3.73EE6 pKa = 4.63GRR8 pKa = 11.84PDD10 pKa = 3.35MLEE13 pKa = 3.93TGVSSWSYY21 pKa = 10.32SPEE24 pKa = 4.12VPDD27 pKa = 4.35EE28 pKa = 4.03EE29 pKa = 4.73MNVDD33 pKa = 5.74FYY35 pKa = 11.54YY36 pKa = 10.79NWSAHH41 pKa = 4.32WW42 pKa = 3.71
Molecular weight: 5.0 kDa
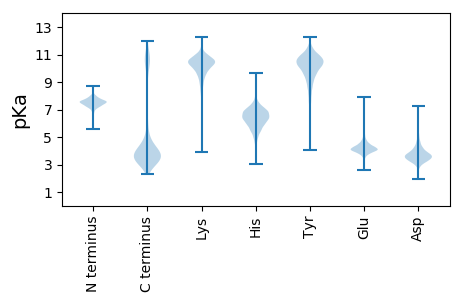
Isoelectric point according different methods:
Protein with the highest isoelectric point:
>tr|F6B7E6|F6B7E6_DESCC Transposase IS605 OrfB family OS=Desulfotomaculum nigrificans (strain DSM 14880 / VKM B-2319 / CO-1-SRB) OX=868595 GN=Desca_0504 PE=4 SV=1
MM1 pKa = 7.36NLEE4 pKa = 4.11TNLANSRR11 pKa = 11.84SSSHH15 pKa = 4.93SRR17 pKa = 11.84AWLLILGIILLASTLRR33 pKa = 11.84APLTAVGPLIGFIRR47 pKa = 11.84DD48 pKa = 3.37DD49 pKa = 3.65TGISNTFAGLLTTFPLLAFAFFSPLAPKK77 pKa = 10.13LARR80 pKa = 11.84RR81 pKa = 11.84FGTEE85 pKa = 3.48YY86 pKa = 10.68TLFASLIVMSLGIVLRR102 pKa = 11.84SLRR105 pKa = 11.84SLEE108 pKa = 3.97TLLVGTALIGIAIAFGNVLLPSLIKK133 pKa = 9.96RR134 pKa = 11.84DD135 pKa = 3.59FPEE138 pKa = 4.13RR139 pKa = 11.84VGLMTGIYY147 pKa = 9.85SIFMNMWAAVASGISIPLAQKK168 pKa = 10.73LGFGWRR174 pKa = 11.84GSLICWSVLSIVSLVAWLPQLRR196 pKa = 11.84VCQRR200 pKa = 11.84PSTSQGVQTPNNNLWHH216 pKa = 6.83SRR218 pKa = 11.84LAWQVSVFMGLQSLTFYY235 pKa = 11.73VMIAWLPEE243 pKa = 3.53ILHH246 pKa = 5.26QQGINHH252 pKa = 6.41SLAGWMLSLMQFVSLPTTLIIPVLAGRR279 pKa = 11.84CSNQRR284 pKa = 11.84RR285 pKa = 11.84LVGFGAVILLTGYY298 pKa = 10.14IGLLSRR304 pKa = 11.84NTLLAPLWIVLIGIAVGTNFSLALIFFVLRR334 pKa = 11.84TQNANDD340 pKa = 3.67AAEE343 pKa = 4.3LSGMAQSIGYY353 pKa = 8.53FLAAVGPPLLGFVHH367 pKa = 7.56DD368 pKa = 4.57MTQSWTAPLCILVVIAILLFIFGLAAGSKK397 pKa = 10.75GYY399 pKa = 8.15VTSKK403 pKa = 11.23NNN405 pKa = 3.12
MM1 pKa = 7.36NLEE4 pKa = 4.11TNLANSRR11 pKa = 11.84SSSHH15 pKa = 4.93SRR17 pKa = 11.84AWLLILGIILLASTLRR33 pKa = 11.84APLTAVGPLIGFIRR47 pKa = 11.84DD48 pKa = 3.37DD49 pKa = 3.65TGISNTFAGLLTTFPLLAFAFFSPLAPKK77 pKa = 10.13LARR80 pKa = 11.84RR81 pKa = 11.84FGTEE85 pKa = 3.48YY86 pKa = 10.68TLFASLIVMSLGIVLRR102 pKa = 11.84SLRR105 pKa = 11.84SLEE108 pKa = 3.97TLLVGTALIGIAIAFGNVLLPSLIKK133 pKa = 9.96RR134 pKa = 11.84DD135 pKa = 3.59FPEE138 pKa = 4.13RR139 pKa = 11.84VGLMTGIYY147 pKa = 9.85SIFMNMWAAVASGISIPLAQKK168 pKa = 10.73LGFGWRR174 pKa = 11.84GSLICWSVLSIVSLVAWLPQLRR196 pKa = 11.84VCQRR200 pKa = 11.84PSTSQGVQTPNNNLWHH216 pKa = 6.83SRR218 pKa = 11.84LAWQVSVFMGLQSLTFYY235 pKa = 11.73VMIAWLPEE243 pKa = 3.53ILHH246 pKa = 5.26QQGINHH252 pKa = 6.41SLAGWMLSLMQFVSLPTTLIIPVLAGRR279 pKa = 11.84CSNQRR284 pKa = 11.84RR285 pKa = 11.84LVGFGAVILLTGYY298 pKa = 10.14IGLLSRR304 pKa = 11.84NTLLAPLWIVLIGIAVGTNFSLALIFFVLRR334 pKa = 11.84TQNANDD340 pKa = 3.67AAEE343 pKa = 4.3LSGMAQSIGYY353 pKa = 8.53FLAAVGPPLLGFVHH367 pKa = 7.56DD368 pKa = 4.57MTQSWTAPLCILVVIAILLFIFGLAAGSKK397 pKa = 10.75GYY399 pKa = 8.15VTSKK403 pKa = 11.23NNN405 pKa = 3.12
Molecular weight: 43.88 kDa
Isoelectric point according different methods:
Peptides (in silico digests for buttom-up proteomics)
Below you can find in silico digests of the whole proteome with Trypsin, Chymotrypsin, Trypsin+LysC, LysN, ArgC proteases suitable for different mass spec machines.| Try ESI |
 |
|---|
| ChTry ESI |
 |
|---|
| ArgC ESI |
 |
|---|
| LysN ESI |
 |
|---|
| TryLysC ESI |
 |
|---|
| Try MALDI |
 |
|---|
| ChTry MALDI |
 |
|---|
| ArgC MALDI |
 |
|---|
| LysN MALDI |
 |
|---|
| TryLysC MALDI |
 |
|---|
| Try LTQ |
 |
|---|
| ChTry LTQ |
 |
|---|
| ArgC LTQ |
 |
|---|
| LysN LTQ |
 |
|---|
| TryLysC LTQ |
 |
|---|
| Try MSlow |
 |
|---|
| ChTry MSlow |
 |
|---|
| ArgC MSlow |
 |
|---|
| LysN MSlow |
 |
|---|
| TryLysC MSlow |
 |
|---|
| Try MShigh |
 |
|---|
| ChTry MShigh |
 |
|---|
| ArgC MShigh |
 |
|---|
| LysN MShigh |
 |
|---|
| TryLysC MShigh |
 |
|---|
General Statistics
Number of major isoforms |
Number of additional isoforms |
Number of all proteins |
Number of amino acids |
Min. Seq. Length |
Max. Seq. Length |
Avg. Seq. Length |
Avg. Mol. Weight |
|---|---|---|---|---|---|---|---|
0 |
789997 |
30 |
2306 |
301.5 |
33.41 |
Amino acid frequency
Ala |
Cys |
Asp |
Glu |
Phe |
Gly |
His |
Ile |
Lys |
Leu |
|---|---|---|---|---|---|---|---|---|---|
8.523 ± 0.05 | 1.199 ± 0.022 |
4.826 ± 0.037 | 6.508 ± 0.053 |
3.667 ± 0.032 | 7.781 ± 0.041 |
1.889 ± 0.018 | 6.982 ± 0.041 |
6.074 ± 0.048 | 10.34 ± 0.05 |
Met |
Asn |
Gln |
Pro |
Arg |
Ser |
Thr |
Val |
Trp |
Tyr |
|---|---|---|---|---|---|---|---|---|---|
2.619 ± 0.022 | 3.971 ± 0.03 |
4.363 ± 0.033 | 4.004 ± 0.034 |
5.223 ± 0.045 | 4.936 ± 0.031 |
5.171 ± 0.032 | 7.853 ± 0.036 |
0.964 ± 0.018 | 3.106 ± 0.03 |
Most of the basic statistics you can see at this page can be downloaded from this CSV file
Proteome-pI is available under Creative Commons Attribution-NoDerivs license, for more details see here
| Reference: Kozlowski LP. Proteome-pI 2.0: Proteome Isoelectric Point Database Update. Nucleic Acids Res. 2021, doi: 10.1093/nar/gkab944 | Contact: Lukasz P. Kozlowski |
