Mesoplasma lactucae ATCC 49193
Taxonomy: cellular organisms; Bacteria; Terrabacteria group; Tenericutes; Mollicutes; Entomoplasmatales; Entomoplasmataceae; Mesoplasma; Mesoplasma lactucae
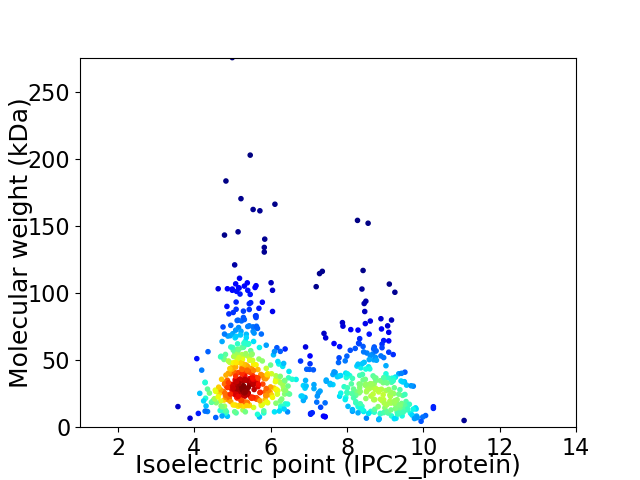
Average proteome isoelectric point is 6.56
Get precalculated fractions of proteins

Virtual 2D-PAGE plot for 689 proteins (isoelectric point calculated using IPC2_protein)
Get csv file with sequences according to given criteria:
* You can choose from 21 different methods for calculating isoelectric point
Summary statistics related to proteome-wise predictions


Protein with the lowest isoelectric point:
>tr|A0A291IRH1|A0A291IRH1_9MOLU Uncharacterized protein OS=Mesoplasma lactucae ATCC 49193 OX=81460 GN=CP520_00745 PE=4 SV=1
MM1 pKa = 8.5SEE3 pKa = 3.84MFFYY7 pKa = 11.08NHH9 pKa = 6.09TKK11 pKa = 9.81MDD13 pKa = 3.52MTDD16 pKa = 3.57WEE18 pKa = 4.41DD19 pKa = 3.54LYY21 pKa = 12.04NNLFITAKK29 pKa = 10.44EE30 pKa = 3.84ILNLEE35 pKa = 4.21NNNLSLAITWVDD47 pKa = 3.07KK48 pKa = 11.41PEE50 pKa = 3.93ALKK53 pKa = 11.02LNQEE57 pKa = 4.24YY58 pKa = 9.89RR59 pKa = 11.84HH60 pKa = 5.5QEE62 pKa = 3.86YY63 pKa = 10.44VPDD66 pKa = 4.26VISFPTEE73 pKa = 3.43MDD75 pKa = 3.37EE76 pKa = 4.74EE77 pKa = 4.57LVKK80 pKa = 11.01EE81 pKa = 4.18MGEE84 pKa = 4.23HH85 pKa = 6.05EE86 pKa = 4.87LGDD89 pKa = 4.38LFICYY94 pKa = 9.92DD95 pKa = 3.63VALEE99 pKa = 4.18KK100 pKa = 10.54ADD102 pKa = 3.99KK103 pKa = 9.22YY104 pKa = 10.34HH105 pKa = 6.56HH106 pKa = 6.61NIYY109 pKa = 10.99EE110 pKa = 3.95EE111 pKa = 4.0MAFLFVHH118 pKa = 6.73GFLHH122 pKa = 6.98LLGYY126 pKa = 10.66DD127 pKa = 3.44HH128 pKa = 7.69DD129 pKa = 5.63LSLEE133 pKa = 4.13DD134 pKa = 3.84EE135 pKa = 4.66KK136 pKa = 11.66EE137 pKa = 3.92MFTIQDD143 pKa = 4.51KK144 pKa = 10.69ILKK147 pKa = 9.49AYY149 pKa = 9.48NINYY153 pKa = 8.76EE154 pKa = 4.17VIYY157 pKa = 10.74DD158 pKa = 3.99DD159 pKa = 4.91EE160 pKa = 7.25DD161 pKa = 3.92YY162 pKa = 11.61LL163 pKa = 5.43
MM1 pKa = 8.5SEE3 pKa = 3.84MFFYY7 pKa = 11.08NHH9 pKa = 6.09TKK11 pKa = 9.81MDD13 pKa = 3.52MTDD16 pKa = 3.57WEE18 pKa = 4.41DD19 pKa = 3.54LYY21 pKa = 12.04NNLFITAKK29 pKa = 10.44EE30 pKa = 3.84ILNLEE35 pKa = 4.21NNNLSLAITWVDD47 pKa = 3.07KK48 pKa = 11.41PEE50 pKa = 3.93ALKK53 pKa = 11.02LNQEE57 pKa = 4.24YY58 pKa = 9.89RR59 pKa = 11.84HH60 pKa = 5.5QEE62 pKa = 3.86YY63 pKa = 10.44VPDD66 pKa = 4.26VISFPTEE73 pKa = 3.43MDD75 pKa = 3.37EE76 pKa = 4.74EE77 pKa = 4.57LVKK80 pKa = 11.01EE81 pKa = 4.18MGEE84 pKa = 4.23HH85 pKa = 6.05EE86 pKa = 4.87LGDD89 pKa = 4.38LFICYY94 pKa = 9.92DD95 pKa = 3.63VALEE99 pKa = 4.18KK100 pKa = 10.54ADD102 pKa = 3.99KK103 pKa = 9.22YY104 pKa = 10.34HH105 pKa = 6.56HH106 pKa = 6.61NIYY109 pKa = 10.99EE110 pKa = 3.95EE111 pKa = 4.0MAFLFVHH118 pKa = 6.73GFLHH122 pKa = 6.98LLGYY126 pKa = 10.66DD127 pKa = 3.44HH128 pKa = 7.69DD129 pKa = 5.63LSLEE133 pKa = 4.13DD134 pKa = 3.84EE135 pKa = 4.66KK136 pKa = 11.66EE137 pKa = 3.92MFTIQDD143 pKa = 4.51KK144 pKa = 10.69ILKK147 pKa = 9.49AYY149 pKa = 9.48NINYY153 pKa = 8.76EE154 pKa = 4.17VIYY157 pKa = 10.74DD158 pKa = 3.99DD159 pKa = 4.91EE160 pKa = 7.25DD161 pKa = 3.92YY162 pKa = 11.61LL163 pKa = 5.43
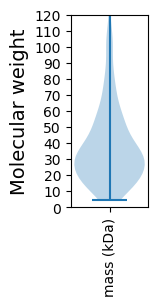
Molecular weight: 19.61 kDa
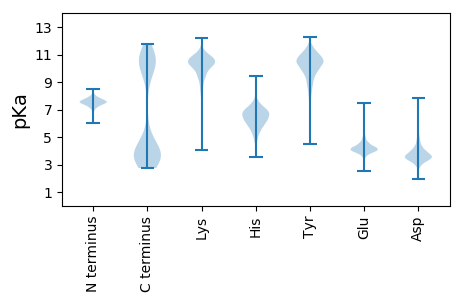
Isoelectric point according different methods:
Protein with the highest isoelectric point:
>tr|A0A291ISL1|A0A291ISL1_9MOLU 30S ribosomal protein S18 OS=Mesoplasma lactucae ATCC 49193 OX=81460 GN=rpsR PE=3 SV=1
MM1 pKa = 7.32KK2 pKa = 9.47RR3 pKa = 11.84TWQPSKK9 pKa = 10.46IKK11 pKa = 9.25TAHH14 pKa = 4.44THH16 pKa = 4.99GFRR19 pKa = 11.84ARR21 pKa = 11.84MASKK25 pKa = 10.57NGRR28 pKa = 11.84KK29 pKa = 9.28VIKK32 pKa = 10.14ARR34 pKa = 11.84RR35 pKa = 11.84AKK37 pKa = 10.34GRR39 pKa = 11.84AKK41 pKa = 10.69LSAA44 pKa = 3.92
MM1 pKa = 7.32KK2 pKa = 9.47RR3 pKa = 11.84TWQPSKK9 pKa = 10.46IKK11 pKa = 9.25TAHH14 pKa = 4.44THH16 pKa = 4.99GFRR19 pKa = 11.84ARR21 pKa = 11.84MASKK25 pKa = 10.57NGRR28 pKa = 11.84KK29 pKa = 9.28VIKK32 pKa = 10.14ARR34 pKa = 11.84RR35 pKa = 11.84AKK37 pKa = 10.34GRR39 pKa = 11.84AKK41 pKa = 10.69LSAA44 pKa = 3.92
Molecular weight: 5.02 kDa
Isoelectric point according different methods:
Peptides (in silico digests for buttom-up proteomics)
Below you can find in silico digests of the whole proteome with Trypsin, Chymotrypsin, Trypsin+LysC, LysN, ArgC proteases suitable for different mass spec machines.| Try ESI |
 |
|---|
| ChTry ESI |
 |
|---|
| ArgC ESI |
 |
|---|
| LysN ESI |
 |
|---|
| TryLysC ESI |
 |
|---|
| Try MALDI |
 |
|---|
| ChTry MALDI |
 |
|---|
| ArgC MALDI |
 |
|---|
| LysN MALDI |
 |
|---|
| TryLysC MALDI |
 |
|---|
| Try LTQ |
 |
|---|
| ChTry LTQ |
 |
|---|
| ArgC LTQ |
 |
|---|
| LysN LTQ |
 |
|---|
| TryLysC LTQ |
 |
|---|
| Try MSlow |
 |
|---|
| ChTry MSlow |
 |
|---|
| ArgC MSlow |
 |
|---|
| LysN MSlow |
 |
|---|
| TryLysC MSlow |
 |
|---|
| Try MShigh |
 |
|---|
| ChTry MShigh |
 |
|---|
| ArgC MShigh |
 |
|---|
| LysN MShigh |
 |
|---|
| TryLysC MShigh |
 |
|---|
General Statistics
Number of major isoforms |
Number of additional isoforms |
Number of all proteins |
Number of amino acids |
Min. Seq. Length |
Max. Seq. Length |
Avg. Seq. Length |
Avg. Mol. Weight |
|---|---|---|---|---|---|---|---|
0 |
246924 |
37 |
2475 |
358.4 |
40.69 |
Amino acid frequency
Ala |
Cys |
Asp |
Glu |
Phe |
Gly |
His |
Ile |
Lys |
Leu |
|---|---|---|---|---|---|---|---|---|---|
6.1 ± 0.097 | 0.517 ± 0.021 |
6.477 ± 0.071 | 6.544 ± 0.108 |
4.709 ± 0.094 | 5.65 ± 0.081 |
1.362 ± 0.038 | 8.344 ± 0.079 |
9.317 ± 0.089 | 8.894 ± 0.078 |
Met |
Asn |
Gln |
Pro |
Arg |
Ser |
Thr |
Val |
Trp |
Tyr |
|---|---|---|---|---|---|---|---|---|---|
2.451 ± 0.05 | 6.982 ± 0.1 |
3.062 ± 0.04 | 3.486 ± 0.055 |
3.121 ± 0.069 | 5.76 ± 0.082 |
5.757 ± 0.082 | 6.348 ± 0.075 |
1.106 ± 0.04 | 4.012 ± 0.074 |
Most of the basic statistics you can see at this page can be downloaded from this CSV file
Proteome-pI is available under Creative Commons Attribution-NoDerivs license, for more details see here
| Reference: Kozlowski LP. Proteome-pI 2.0: Proteome Isoelectric Point Database Update. Nucleic Acids Res. 2021, doi: 10.1093/nar/gkab944 | Contact: Lukasz P. Kozlowski |
