Sugarcane streak virus (isolate South Africa) (SSV) (Sugarcane streak virus (isolate Natal))
Taxonomy: Viruses; Monodnaviria; Shotokuvirae; Cressdnaviricota; Repensiviricetes; Geplafuvirales; Geminiviridae; Mastrevirus; Sugarcane streak virus
Average proteome isoelectric point is 7.66
Get precalculated fractions of proteins

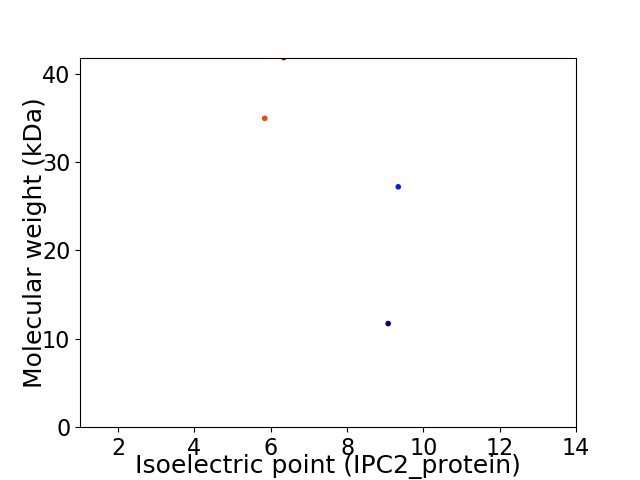
Virtual 2D-PAGE plot for 4 proteins (isoelectric point calculated using IPC2_protein)
Get csv file with sequences according to given criteria:
* You can choose from 21 different methods for calculating isoelectric point
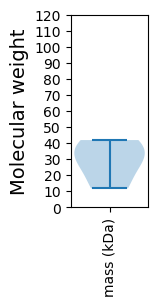
Summary statistics related to proteome-wise predictions


Protein with the lowest isoelectric point:
>sp|Q89822|REPA_SSVN Replication-associated protein A OS=Sugarcane streak virus (isolate South Africa) OX=268781 GN=C1 PE=3 SV=1
MM1 pKa = 6.92STVGSTVSSTPSRR14 pKa = 11.84RR15 pKa = 11.84FKK17 pKa = 10.63HH18 pKa = 6.37RR19 pKa = 11.84NVNTFLTYY27 pKa = 10.36SRR29 pKa = 11.84CPLEE33 pKa = 4.17PEE35 pKa = 4.25AVGLHH40 pKa = 5.28IWSLIAHH47 pKa = 6.26WTPVYY52 pKa = 10.2VLSVRR57 pKa = 11.84EE58 pKa = 3.86THH60 pKa = 6.75EE61 pKa = 4.49DD62 pKa = 3.07GGYY65 pKa = 9.93HH66 pKa = 5.24IHH68 pKa = 6.87VLAQSAKK75 pKa = 9.59PVYY78 pKa = 8.36TTDD81 pKa = 3.66SGFFDD86 pKa = 3.91IDD88 pKa = 3.45GFHH91 pKa = 7.45PNIQSAKK98 pKa = 8.75SANKK102 pKa = 8.73VRR104 pKa = 11.84AYY106 pKa = 10.8AMKK109 pKa = 10.84NPVTYY114 pKa = 9.5WEE116 pKa = 4.69RR117 pKa = 11.84GTFIPRR123 pKa = 11.84KK124 pKa = 7.95TSFLGDD130 pKa = 3.47STEE133 pKa = 4.28PNSKK137 pKa = 9.98KK138 pKa = 9.84QSKK141 pKa = 10.53DD142 pKa = 3.27DD143 pKa = 3.36IVRR146 pKa = 11.84DD147 pKa = 4.03IIEE150 pKa = 4.43HH151 pKa = 5.04STNKK155 pKa = 9.66QEE157 pKa = 4.09YY158 pKa = 10.37LSMIQKK164 pKa = 10.03ALPYY168 pKa = 9.73EE169 pKa = 4.28WATKK173 pKa = 9.84LQYY176 pKa = 10.43FEE178 pKa = 4.96YY179 pKa = 10.26SANKK183 pKa = 9.66LFPDD187 pKa = 3.01IQEE190 pKa = 4.71IYY192 pKa = 9.95TSPFPQSTPALLDD205 pKa = 3.23PTAINTWLEE214 pKa = 3.83NNLYY218 pKa = 9.77QVSPSAYY225 pKa = 7.96MLANPSCLTLEE236 pKa = 4.43EE237 pKa = 4.36ATSDD241 pKa = 4.45LIWMHH246 pKa = 5.23EE247 pKa = 4.23TSRR250 pKa = 11.84TLIPTGSSACTSSGQQEE267 pKa = 4.42QASPPGPGAWEE278 pKa = 4.6DD279 pKa = 3.73IITGRR284 pKa = 11.84TTSTGPPTTRR294 pKa = 11.84TQNTTSSTTYY304 pKa = 9.97PSSTVHH310 pKa = 6.56AGSNN314 pKa = 3.37
MM1 pKa = 6.92STVGSTVSSTPSRR14 pKa = 11.84RR15 pKa = 11.84FKK17 pKa = 10.63HH18 pKa = 6.37RR19 pKa = 11.84NVNTFLTYY27 pKa = 10.36SRR29 pKa = 11.84CPLEE33 pKa = 4.17PEE35 pKa = 4.25AVGLHH40 pKa = 5.28IWSLIAHH47 pKa = 6.26WTPVYY52 pKa = 10.2VLSVRR57 pKa = 11.84EE58 pKa = 3.86THH60 pKa = 6.75EE61 pKa = 4.49DD62 pKa = 3.07GGYY65 pKa = 9.93HH66 pKa = 5.24IHH68 pKa = 6.87VLAQSAKK75 pKa = 9.59PVYY78 pKa = 8.36TTDD81 pKa = 3.66SGFFDD86 pKa = 3.91IDD88 pKa = 3.45GFHH91 pKa = 7.45PNIQSAKK98 pKa = 8.75SANKK102 pKa = 8.73VRR104 pKa = 11.84AYY106 pKa = 10.8AMKK109 pKa = 10.84NPVTYY114 pKa = 9.5WEE116 pKa = 4.69RR117 pKa = 11.84GTFIPRR123 pKa = 11.84KK124 pKa = 7.95TSFLGDD130 pKa = 3.47STEE133 pKa = 4.28PNSKK137 pKa = 9.98KK138 pKa = 9.84QSKK141 pKa = 10.53DD142 pKa = 3.27DD143 pKa = 3.36IVRR146 pKa = 11.84DD147 pKa = 4.03IIEE150 pKa = 4.43HH151 pKa = 5.04STNKK155 pKa = 9.66QEE157 pKa = 4.09YY158 pKa = 10.37LSMIQKK164 pKa = 10.03ALPYY168 pKa = 9.73EE169 pKa = 4.28WATKK173 pKa = 9.84LQYY176 pKa = 10.43FEE178 pKa = 4.96YY179 pKa = 10.26SANKK183 pKa = 9.66LFPDD187 pKa = 3.01IQEE190 pKa = 4.71IYY192 pKa = 9.95TSPFPQSTPALLDD205 pKa = 3.23PTAINTWLEE214 pKa = 3.83NNLYY218 pKa = 9.77QVSPSAYY225 pKa = 7.96MLANPSCLTLEE236 pKa = 4.43EE237 pKa = 4.36ATSDD241 pKa = 4.45LIWMHH246 pKa = 5.23EE247 pKa = 4.23TSRR250 pKa = 11.84TLIPTGSSACTSSGQQEE267 pKa = 4.42QASPPGPGAWEE278 pKa = 4.6DD279 pKa = 3.73IITGRR284 pKa = 11.84TTSTGPPTTRR294 pKa = 11.84TQNTTSSTTYY304 pKa = 9.97PSSTVHH310 pKa = 6.56AGSNN314 pKa = 3.37
Molecular weight: 34.94 kDa
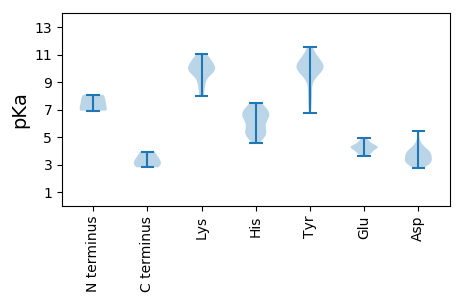
Isoelectric point according different methods:
Protein with the highest isoelectric point:
>sp|Q89551|CAPSD_SSVN Capsid protein OS=Sugarcane streak virus (isolate South Africa) OX=268781 GN=V1 PE=3 SV=1
MM1 pKa = 8.08DD2 pKa = 4.02SFGRR6 pKa = 11.84APPLWPQSALPRR18 pKa = 11.84VPGAAPSSSGLPWSRR33 pKa = 11.84VGEE36 pKa = 3.84IAIFTFVAVLALYY49 pKa = 9.37LLWSWVGRR57 pKa = 11.84DD58 pKa = 3.44LLLVLKK64 pKa = 10.23ARR66 pKa = 11.84RR67 pKa = 11.84GGTTEE72 pKa = 4.03EE73 pKa = 4.3LTFGPRR79 pKa = 11.84EE80 pKa = 4.06RR81 pKa = 11.84HH82 pKa = 5.67SLPAVAVARR91 pKa = 11.84VEE93 pKa = 4.46NPPCPSGSVEE103 pKa = 3.83ARR105 pKa = 11.84PFTGG109 pKa = 3.94
MM1 pKa = 8.08DD2 pKa = 4.02SFGRR6 pKa = 11.84APPLWPQSALPRR18 pKa = 11.84VPGAAPSSSGLPWSRR33 pKa = 11.84VGEE36 pKa = 3.84IAIFTFVAVLALYY49 pKa = 9.37LLWSWVGRR57 pKa = 11.84DD58 pKa = 3.44LLLVLKK64 pKa = 10.23ARR66 pKa = 11.84RR67 pKa = 11.84GGTTEE72 pKa = 4.03EE73 pKa = 4.3LTFGPRR79 pKa = 11.84EE80 pKa = 4.06RR81 pKa = 11.84HH82 pKa = 5.67SLPAVAVARR91 pKa = 11.84VEE93 pKa = 4.46NPPCPSGSVEE103 pKa = 3.83ARR105 pKa = 11.84PFTGG109 pKa = 3.94
Molecular weight: 11.72 kDa
Isoelectric point according different methods:
Peptides (in silico digests for buttom-up proteomics)
Below you can find in silico digests of the whole proteome with Trypsin, Chymotrypsin, Trypsin+LysC, LysN, ArgC proteases suitable for different mass spec machines.| Try ESI |
 |
|---|
| ChTry ESI |
 |
|---|
| ArgC ESI |
 |
|---|
| LysN ESI |
 |
|---|
| TryLysC ESI |
 |
|---|
| Try MALDI |
 |
|---|
| ChTry MALDI |
 |
|---|
| ArgC MALDI |
 |
|---|
| LysN MALDI |
 |
|---|
| TryLysC MALDI |
 |
|---|
| Try LTQ |
 |
|---|
| ChTry LTQ |
 |
|---|
| ArgC LTQ |
 |
|---|
| LysN LTQ |
 |
|---|
| TryLysC LTQ |
 |
|---|
| Try MSlow |
 |
|---|
| ChTry MSlow |
 |
|---|
| ArgC MSlow |
 |
|---|
| LysN MSlow |
 |
|---|
| TryLysC MSlow |
 |
|---|
| Try MShigh |
 |
|---|
| ChTry MShigh |
 |
|---|
| ArgC MShigh |
 |
|---|
| LysN MShigh |
 |
|---|
| TryLysC MShigh |
 |
|---|
General Statistics
Number of major isoforms |
Number of additional isoforms |
Number of all proteins |
Number of amino acids |
Min. Seq. Length |
Max. Seq. Length |
Avg. Seq. Length |
Avg. Mol. Weight |
|---|---|---|---|---|---|---|---|
0 |
1035 |
109 |
364 |
258.8 |
28.92 |
Amino acid frequency
Ala |
Cys |
Asp |
Glu |
Phe |
Gly |
His |
Ile |
Lys |
Leu |
|---|---|---|---|---|---|---|---|---|---|
6.763 ± 0.727 | 1.353 ± 0.215 |
4.251 ± 0.604 | 4.928 ± 0.488 |
3.768 ± 0.223 | 6.377 ± 1.536 |
2.609 ± 0.317 | 5.024 ± 0.577 |
5.121 ± 0.92 | 6.667 ± 0.943 |
Met |
Asn |
Gln |
Pro |
Arg |
Ser |
Thr |
Val |
Trp |
Tyr |
|---|---|---|---|---|---|---|---|---|---|
1.449 ± 0.103 | 4.444 ± 0.817 |
7.246 ± 0.886 | 3.382 ± 0.561 |
5.507 ± 0.99 | 9.758 ± 0.799 |
8.502 ± 1.268 | 6.087 ± 0.969 |
2.512 ± 0.244 | 4.251 ± 0.79 |
Most of the basic statistics you can see at this page can be downloaded from this CSV file
Proteome-pI is available under Creative Commons Attribution-NoDerivs license, for more details see here
| Reference: Kozlowski LP. Proteome-pI 2.0: Proteome Isoelectric Point Database Update. Nucleic Acids Res. 2021, doi: 10.1093/nar/gkab944 | Contact: Lukasz P. Kozlowski |
