Bacillus caeni
Taxonomy: cellular organisms; Bacteria; Terrabacteria group; Firmicutes; Bacilli; Bacillales; Bacillaceae; Alkalihalobacillus
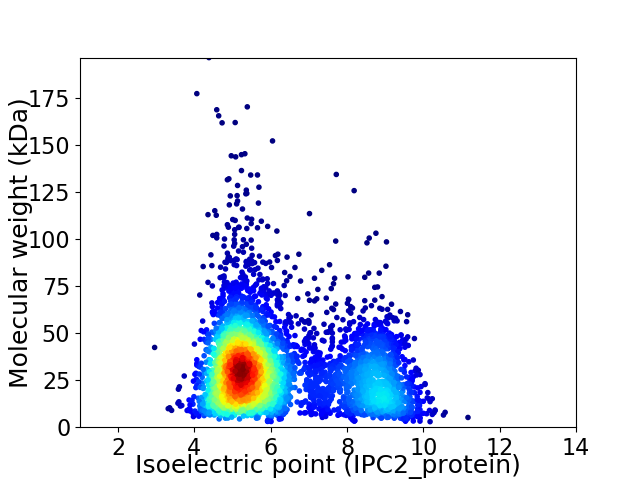
Average proteome isoelectric point is 6.23
Get precalculated fractions of proteins

Virtual 2D-PAGE plot for 4545 proteins (isoelectric point calculated using IPC2_protein)
Get csv file with sequences according to given criteria:
* You can choose from 21 different methods for calculating isoelectric point
Summary statistics related to proteome-wise predictions


Protein with the lowest isoelectric point:
>tr|A0A5R9F5G4|A0A5R9F5G4_9BACI Uncharacterized protein OS=Bacillus caeni OX=2574798 GN=FCL54_10580 PE=4 SV=1
MM1 pKa = 7.5SLEE4 pKa = 3.82WFDD7 pKa = 3.9RR8 pKa = 11.84VSGEE12 pKa = 4.11LQDD15 pKa = 4.16HH16 pKa = 6.79LEE18 pKa = 4.52SICDD22 pKa = 3.34KK23 pKa = 10.24YY24 pKa = 11.58DD25 pKa = 3.46QVGHH29 pKa = 5.36MSIDD33 pKa = 3.19RR34 pKa = 11.84GAKK37 pKa = 8.39HH38 pKa = 6.11PRR40 pKa = 11.84IEE42 pKa = 4.85FYY44 pKa = 11.36VEE46 pKa = 3.52TDD48 pKa = 3.24DD49 pKa = 5.79DD50 pKa = 3.9GRR52 pKa = 11.84EE53 pKa = 4.12YY54 pKa = 10.75FCSLFYY60 pKa = 10.83DD61 pKa = 3.55PHH63 pKa = 7.59NEE65 pKa = 3.62EE66 pKa = 5.7FYY68 pKa = 10.93TEE70 pKa = 5.26SYY72 pKa = 11.38DD73 pKa = 4.7LDD75 pKa = 4.19LEE77 pKa = 4.54HH78 pKa = 7.16TSRR81 pKa = 11.84TILTDD86 pKa = 3.1IDD88 pKa = 4.02DD89 pKa = 5.7LIDD92 pKa = 3.8AVHH95 pKa = 6.58EE96 pKa = 4.39SFHH99 pKa = 9.03DD100 pKa = 3.68YY101 pKa = 10.62MNEE104 pKa = 3.29EE105 pKa = 4.66DD106 pKa = 4.28IYY108 pKa = 11.6VEE110 pKa = 4.25NEE112 pKa = 3.77EE113 pKa = 5.68LYY115 pKa = 10.42MDD117 pKa = 5.3DD118 pKa = 4.23EE119 pKa = 5.29YY120 pKa = 11.04IDD122 pKa = 3.56EE123 pKa = 5.34GYY125 pKa = 11.01EE126 pKa = 3.76LDD128 pKa = 3.96NEE130 pKa = 4.34FEE132 pKa = 3.96EE133 pKa = 6.0GYY135 pKa = 10.54YY136 pKa = 10.63EE137 pKa = 4.13EE138 pKa = 5.95DD139 pKa = 3.36YY140 pKa = 11.62SEE142 pKa = 5.47AIEE145 pKa = 4.61NEE147 pKa = 4.14IEE149 pKa = 4.37VEE151 pKa = 4.21WITPEE156 pKa = 3.69VTAYY160 pKa = 10.27SHH162 pKa = 6.49EE163 pKa = 4.67DD164 pKa = 3.62EE165 pKa = 5.43VNVTYY170 pKa = 10.78QFGVVQEE177 pKa = 4.33TGDD180 pKa = 3.95GILRR184 pKa = 11.84RR185 pKa = 11.84FNRR188 pKa = 11.84VITTEE193 pKa = 3.95DD194 pKa = 3.27SLIEE198 pKa = 4.4DD199 pKa = 3.7EE200 pKa = 5.37SNFIFSKK207 pKa = 11.09DD208 pKa = 3.31EE209 pKa = 4.3AGTIISMIASNMDD222 pKa = 3.55SLSDD226 pKa = 3.67FDD228 pKa = 5.72FEE230 pKa = 4.7
MM1 pKa = 7.5SLEE4 pKa = 3.82WFDD7 pKa = 3.9RR8 pKa = 11.84VSGEE12 pKa = 4.11LQDD15 pKa = 4.16HH16 pKa = 6.79LEE18 pKa = 4.52SICDD22 pKa = 3.34KK23 pKa = 10.24YY24 pKa = 11.58DD25 pKa = 3.46QVGHH29 pKa = 5.36MSIDD33 pKa = 3.19RR34 pKa = 11.84GAKK37 pKa = 8.39HH38 pKa = 6.11PRR40 pKa = 11.84IEE42 pKa = 4.85FYY44 pKa = 11.36VEE46 pKa = 3.52TDD48 pKa = 3.24DD49 pKa = 5.79DD50 pKa = 3.9GRR52 pKa = 11.84EE53 pKa = 4.12YY54 pKa = 10.75FCSLFYY60 pKa = 10.83DD61 pKa = 3.55PHH63 pKa = 7.59NEE65 pKa = 3.62EE66 pKa = 5.7FYY68 pKa = 10.93TEE70 pKa = 5.26SYY72 pKa = 11.38DD73 pKa = 4.7LDD75 pKa = 4.19LEE77 pKa = 4.54HH78 pKa = 7.16TSRR81 pKa = 11.84TILTDD86 pKa = 3.1IDD88 pKa = 4.02DD89 pKa = 5.7LIDD92 pKa = 3.8AVHH95 pKa = 6.58EE96 pKa = 4.39SFHH99 pKa = 9.03DD100 pKa = 3.68YY101 pKa = 10.62MNEE104 pKa = 3.29EE105 pKa = 4.66DD106 pKa = 4.28IYY108 pKa = 11.6VEE110 pKa = 4.25NEE112 pKa = 3.77EE113 pKa = 5.68LYY115 pKa = 10.42MDD117 pKa = 5.3DD118 pKa = 4.23EE119 pKa = 5.29YY120 pKa = 11.04IDD122 pKa = 3.56EE123 pKa = 5.34GYY125 pKa = 11.01EE126 pKa = 3.76LDD128 pKa = 3.96NEE130 pKa = 4.34FEE132 pKa = 3.96EE133 pKa = 6.0GYY135 pKa = 10.54YY136 pKa = 10.63EE137 pKa = 4.13EE138 pKa = 5.95DD139 pKa = 3.36YY140 pKa = 11.62SEE142 pKa = 5.47AIEE145 pKa = 4.61NEE147 pKa = 4.14IEE149 pKa = 4.37VEE151 pKa = 4.21WITPEE156 pKa = 3.69VTAYY160 pKa = 10.27SHH162 pKa = 6.49EE163 pKa = 4.67DD164 pKa = 3.62EE165 pKa = 5.43VNVTYY170 pKa = 10.78QFGVVQEE177 pKa = 4.33TGDD180 pKa = 3.95GILRR184 pKa = 11.84RR185 pKa = 11.84FNRR188 pKa = 11.84VITTEE193 pKa = 3.95DD194 pKa = 3.27SLIEE198 pKa = 4.4DD199 pKa = 3.7EE200 pKa = 5.37SNFIFSKK207 pKa = 11.09DD208 pKa = 3.31EE209 pKa = 4.3AGTIISMIASNMDD222 pKa = 3.55SLSDD226 pKa = 3.67FDD228 pKa = 5.72FEE230 pKa = 4.7
Molecular weight: 27.22 kDa
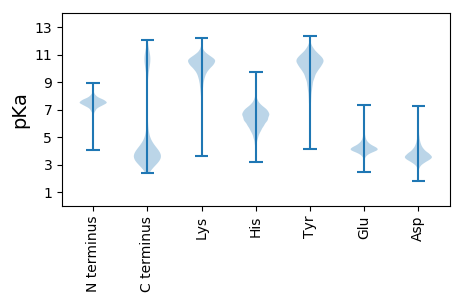
Isoelectric point according different methods:
Protein with the highest isoelectric point:
>tr|A0A5R9EXD2|A0A5R9EXD2_9BACI Elongation factor Tu OS=Bacillus caeni OX=2574798 GN=tuf PE=3 SV=1
MM1 pKa = 7.6KK2 pKa = 8.74PTFQPNNRR10 pKa = 11.84KK11 pKa = 9.23RR12 pKa = 11.84KK13 pKa = 8.22KK14 pKa = 8.69VHH16 pKa = 5.46GFRR19 pKa = 11.84ARR21 pKa = 11.84MSTKK25 pKa = 10.19NGRR28 pKa = 11.84KK29 pKa = 8.37VLARR33 pKa = 11.84RR34 pKa = 11.84RR35 pKa = 11.84SKK37 pKa = 10.59GRR39 pKa = 11.84KK40 pKa = 8.44VLSAA44 pKa = 4.05
MM1 pKa = 7.6KK2 pKa = 8.74PTFQPNNRR10 pKa = 11.84KK11 pKa = 9.23RR12 pKa = 11.84KK13 pKa = 8.22KK14 pKa = 8.69VHH16 pKa = 5.46GFRR19 pKa = 11.84ARR21 pKa = 11.84MSTKK25 pKa = 10.19NGRR28 pKa = 11.84KK29 pKa = 8.37VLARR33 pKa = 11.84RR34 pKa = 11.84RR35 pKa = 11.84SKK37 pKa = 10.59GRR39 pKa = 11.84KK40 pKa = 8.44VLSAA44 pKa = 4.05
Molecular weight: 5.18 kDa
Isoelectric point according different methods:
Peptides (in silico digests for buttom-up proteomics)
Below you can find in silico digests of the whole proteome with Trypsin, Chymotrypsin, Trypsin+LysC, LysN, ArgC proteases suitable for different mass spec machines.| Try ESI |
 |
|---|
| ChTry ESI |
 |
|---|
| ArgC ESI |
 |
|---|
| LysN ESI |
 |
|---|
| TryLysC ESI |
 |
|---|
| Try MALDI |
 |
|---|
| ChTry MALDI |
 |
|---|
| ArgC MALDI |
 |
|---|
| LysN MALDI |
 |
|---|
| TryLysC MALDI |
 |
|---|
| Try LTQ |
 |
|---|
| ChTry LTQ |
 |
|---|
| ArgC LTQ |
 |
|---|
| LysN LTQ |
 |
|---|
| TryLysC LTQ |
 |
|---|
| Try MSlow |
 |
|---|
| ChTry MSlow |
 |
|---|
| ArgC MSlow |
 |
|---|
| LysN MSlow |
 |
|---|
| TryLysC MSlow |
 |
|---|
| Try MShigh |
 |
|---|
| ChTry MShigh |
 |
|---|
| ArgC MShigh |
 |
|---|
| LysN MShigh |
 |
|---|
| TryLysC MShigh |
 |
|---|
General Statistics
Number of major isoforms |
Number of additional isoforms |
Number of all proteins |
Number of amino acids |
Min. Seq. Length |
Max. Seq. Length |
Avg. Seq. Length |
Avg. Mol. Weight |
|---|---|---|---|---|---|---|---|
0 |
1304964 |
25 |
1771 |
287.1 |
32.24 |
Amino acid frequency
Ala |
Cys |
Asp |
Glu |
Phe |
Gly |
His |
Ile |
Lys |
Leu |
|---|---|---|---|---|---|---|---|---|---|
6.875 ± 0.039 | 0.672 ± 0.01 |
5.205 ± 0.027 | 7.933 ± 0.052 |
4.549 ± 0.038 | 7.113 ± 0.037 |
1.993 ± 0.02 | 7.505 ± 0.034 |
7.164 ± 0.041 | 9.651 ± 0.044 |
Met |
Asn |
Gln |
Pro |
Arg |
Ser |
Thr |
Val |
Trp |
Tyr |
|---|---|---|---|---|---|---|---|---|---|
2.704 ± 0.016 | 4.517 ± 0.024 |
3.711 ± 0.019 | 3.456 ± 0.024 |
4.092 ± 0.028 | 6.011 ± 0.027 |
5.221 ± 0.025 | 7.08 ± 0.029 |
1.067 ± 0.015 | 3.481 ± 0.024 |
Most of the basic statistics you can see at this page can be downloaded from this CSV file
Proteome-pI is available under Creative Commons Attribution-NoDerivs license, for more details see here
| Reference: Kozlowski LP. Proteome-pI 2.0: Proteome Isoelectric Point Database Update. Nucleic Acids Res. 2021, doi: 10.1093/nar/gkab944 | Contact: Lukasz P. Kozlowski |
