Arthrobacter echini
Taxonomy: cellular organisms; Bacteria; Terrabacteria group; Actinobacteria; Actinomycetia; Micrococcales; Micrococcaceae; Arthrobacter
Average proteome isoelectric point is 6.05
Get precalculated fractions of proteins

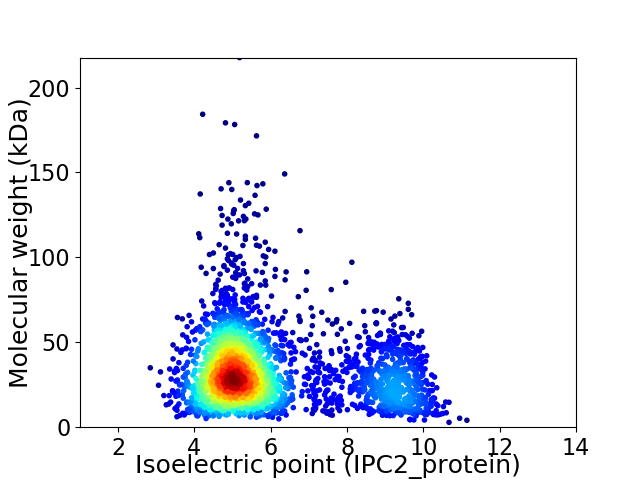
Virtual 2D-PAGE plot for 2848 proteins (isoelectric point calculated using IPC2_protein)
Get csv file with sequences according to given criteria:
* You can choose from 21 different methods for calculating isoelectric point
Summary statistics related to proteome-wise predictions


Protein with the lowest isoelectric point:
>tr|A0A4S5E3U7|A0A4S5E3U7_9MICC PH domain-containing protein OS=Arthrobacter echini OX=1529066 GN=E8P82_10560 PE=4 SV=1
MM1 pKa = 7.87RR2 pKa = 11.84KK3 pKa = 7.64TRR5 pKa = 11.84YY6 pKa = 6.62TAAAIAAVTALTLSACGGGDD26 pKa = 3.62DD27 pKa = 5.18DD28 pKa = 5.46AAGSSGASGEE38 pKa = 4.23AGGEE42 pKa = 4.18SVRR45 pKa = 11.84IGIKK49 pKa = 10.03FDD51 pKa = 3.5QPGLGFDD58 pKa = 3.68EE59 pKa = 5.09GGSYY63 pKa = 10.6SGFDD67 pKa = 3.18VDD69 pKa = 3.87VARR72 pKa = 11.84YY73 pKa = 7.93VANEE77 pKa = 3.86LGYY80 pKa = 9.29TDD82 pKa = 3.77EE83 pKa = 5.1QIDD86 pKa = 4.08FVEE89 pKa = 4.63SPSANRR95 pKa = 11.84EE96 pKa = 3.59NMLANDD102 pKa = 3.73QVDD105 pKa = 4.42MIFATYY111 pKa = 10.44SITDD115 pKa = 3.53TRR117 pKa = 11.84KK118 pKa = 8.21EE119 pKa = 4.34TVDD122 pKa = 3.6FAGPYY127 pKa = 9.96FIAGQDD133 pKa = 3.64LLVPTDD139 pKa = 3.6SDD141 pKa = 3.41ITGPEE146 pKa = 3.99DD147 pKa = 3.57LEE149 pKa = 4.25GRR151 pKa = 11.84NLCSVTGSTSAEE163 pKa = 4.12QIKK166 pKa = 9.42EE167 pKa = 3.96QYY169 pKa = 10.1PGVQLVEE176 pKa = 3.88QPGYY180 pKa = 10.33AEE182 pKa = 5.14CVTAMGGGQIDD193 pKa = 4.3AVTTDD198 pKa = 4.42DD199 pKa = 5.44IILAGLAAQDD209 pKa = 4.12ANAGQYY215 pKa = 9.93RR216 pKa = 11.84VVGNTFSEE224 pKa = 4.05EE225 pKa = 4.35RR226 pKa = 11.84YY227 pKa = 10.31GVGLPPGSDD236 pKa = 2.74RR237 pKa = 11.84CEE239 pKa = 4.96DD240 pKa = 3.02INAAITQMIEE250 pKa = 3.49SGAWEE255 pKa = 3.94EE256 pKa = 3.88ALAANTEE263 pKa = 4.32GADD266 pKa = 3.42YY267 pKa = 10.83SYY269 pKa = 11.78NEE271 pKa = 4.86DD272 pKa = 4.09LNPPEE277 pKa = 5.16PEE279 pKa = 3.99PCAA282 pKa = 3.95
MM1 pKa = 7.87RR2 pKa = 11.84KK3 pKa = 7.64TRR5 pKa = 11.84YY6 pKa = 6.62TAAAIAAVTALTLSACGGGDD26 pKa = 3.62DD27 pKa = 5.18DD28 pKa = 5.46AAGSSGASGEE38 pKa = 4.23AGGEE42 pKa = 4.18SVRR45 pKa = 11.84IGIKK49 pKa = 10.03FDD51 pKa = 3.5QPGLGFDD58 pKa = 3.68EE59 pKa = 5.09GGSYY63 pKa = 10.6SGFDD67 pKa = 3.18VDD69 pKa = 3.87VARR72 pKa = 11.84YY73 pKa = 7.93VANEE77 pKa = 3.86LGYY80 pKa = 9.29TDD82 pKa = 3.77EE83 pKa = 5.1QIDD86 pKa = 4.08FVEE89 pKa = 4.63SPSANRR95 pKa = 11.84EE96 pKa = 3.59NMLANDD102 pKa = 3.73QVDD105 pKa = 4.42MIFATYY111 pKa = 10.44SITDD115 pKa = 3.53TRR117 pKa = 11.84KK118 pKa = 8.21EE119 pKa = 4.34TVDD122 pKa = 3.6FAGPYY127 pKa = 9.96FIAGQDD133 pKa = 3.64LLVPTDD139 pKa = 3.6SDD141 pKa = 3.41ITGPEE146 pKa = 3.99DD147 pKa = 3.57LEE149 pKa = 4.25GRR151 pKa = 11.84NLCSVTGSTSAEE163 pKa = 4.12QIKK166 pKa = 9.42EE167 pKa = 3.96QYY169 pKa = 10.1PGVQLVEE176 pKa = 3.88QPGYY180 pKa = 10.33AEE182 pKa = 5.14CVTAMGGGQIDD193 pKa = 4.3AVTTDD198 pKa = 4.42DD199 pKa = 5.44IILAGLAAQDD209 pKa = 4.12ANAGQYY215 pKa = 9.93RR216 pKa = 11.84VVGNTFSEE224 pKa = 4.05EE225 pKa = 4.35RR226 pKa = 11.84YY227 pKa = 10.31GVGLPPGSDD236 pKa = 2.74RR237 pKa = 11.84CEE239 pKa = 4.96DD240 pKa = 3.02INAAITQMIEE250 pKa = 3.49SGAWEE255 pKa = 3.94EE256 pKa = 3.88ALAANTEE263 pKa = 4.32GADD266 pKa = 3.42YY267 pKa = 10.83SYY269 pKa = 11.78NEE271 pKa = 4.86DD272 pKa = 4.09LNPPEE277 pKa = 5.16PEE279 pKa = 3.99PCAA282 pKa = 3.95
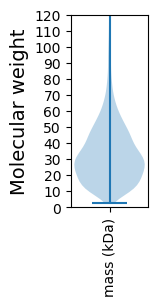
Molecular weight: 29.56 kDa
Isoelectric point according different methods:
Protein with the highest isoelectric point:
>tr|A0A4S5E9K8|A0A4S5E9K8_9MICC HAD-IB family hydrolase OS=Arthrobacter echini OX=1529066 GN=E8P82_00285 PE=3 SV=1
MM1 pKa = 7.4GSVIKK6 pKa = 10.42KK7 pKa = 8.47RR8 pKa = 11.84RR9 pKa = 11.84KK10 pKa = 9.22RR11 pKa = 11.84MAKK14 pKa = 9.41KK15 pKa = 9.87KK16 pKa = 9.7HH17 pKa = 5.84RR18 pKa = 11.84KK19 pKa = 8.56LLRR22 pKa = 11.84KK23 pKa = 7.78TRR25 pKa = 11.84HH26 pKa = 3.65QRR28 pKa = 11.84RR29 pKa = 11.84NKK31 pKa = 9.78KK32 pKa = 9.85
MM1 pKa = 7.4GSVIKK6 pKa = 10.42KK7 pKa = 8.47RR8 pKa = 11.84RR9 pKa = 11.84KK10 pKa = 9.22RR11 pKa = 11.84MAKK14 pKa = 9.41KK15 pKa = 9.87KK16 pKa = 9.7HH17 pKa = 5.84RR18 pKa = 11.84KK19 pKa = 8.56LLRR22 pKa = 11.84KK23 pKa = 7.78TRR25 pKa = 11.84HH26 pKa = 3.65QRR28 pKa = 11.84RR29 pKa = 11.84NKK31 pKa = 9.78KK32 pKa = 9.85
Molecular weight: 4.08 kDa
Isoelectric point according different methods:
Peptides (in silico digests for buttom-up proteomics)
Below you can find in silico digests of the whole proteome with Trypsin, Chymotrypsin, Trypsin+LysC, LysN, ArgC proteases suitable for different mass spec machines.| Try ESI |
 |
|---|
| ChTry ESI |
 |
|---|
| ArgC ESI |
 |
|---|
| LysN ESI |
 |
|---|
| TryLysC ESI |
 |
|---|
| Try MALDI |
 |
|---|
| ChTry MALDI |
 |
|---|
| ArgC MALDI |
 |
|---|
| LysN MALDI |
 |
|---|
| TryLysC MALDI |
 |
|---|
| Try LTQ |
 |
|---|
| ChTry LTQ |
 |
|---|
| ArgC LTQ |
 |
|---|
| LysN LTQ |
 |
|---|
| TryLysC LTQ |
 |
|---|
| Try MSlow |
 |
|---|
| ChTry MSlow |
 |
|---|
| ArgC MSlow |
 |
|---|
| LysN MSlow |
 |
|---|
| TryLysC MSlow |
 |
|---|
| Try MShigh |
 |
|---|
| ChTry MShigh |
 |
|---|
| ArgC MShigh |
 |
|---|
| LysN MShigh |
 |
|---|
| TryLysC MShigh |
 |
|---|
General Statistics
Number of major isoforms |
Number of additional isoforms |
Number of all proteins |
Number of amino acids |
Min. Seq. Length |
Max. Seq. Length |
Avg. Seq. Length |
Avg. Mol. Weight |
|---|---|---|---|---|---|---|---|
0 |
924687 |
24 |
1983 |
324.7 |
34.84 |
Amino acid frequency
Ala |
Cys |
Asp |
Glu |
Phe |
Gly |
His |
Ile |
Lys |
Leu |
|---|---|---|---|---|---|---|---|---|---|
12.485 ± 0.06 | 0.566 ± 0.011 |
6.185 ± 0.036 | 5.879 ± 0.039 |
3.069 ± 0.03 | 8.99 ± 0.047 |
2.067 ± 0.021 | 4.294 ± 0.033 |
2.006 ± 0.035 | 10.425 ± 0.054 |
Met |
Asn |
Gln |
Pro |
Arg |
Ser |
Thr |
Val |
Trp |
Tyr |
|---|---|---|---|---|---|---|---|---|---|
1.864 ± 0.018 | 2.069 ± 0.022 |
5.4 ± 0.032 | 3.059 ± 0.025 |
7.349 ± 0.048 | 6.114 ± 0.032 |
6.154 ± 0.036 | 8.659 ± 0.042 |
1.366 ± 0.018 | 1.999 ± 0.02 |
Most of the basic statistics you can see at this page can be downloaded from this CSV file
Proteome-pI is available under Creative Commons Attribution-NoDerivs license, for more details see here
| Reference: Kozlowski LP. Proteome-pI 2.0: Proteome Isoelectric Point Database Update. Nucleic Acids Res. 2021, doi: 10.1093/nar/gkab944 | Contact: Lukasz P. Kozlowski |
