Streptomonospora sp. M2
Taxonomy: cellular organisms; Bacteria; Terrabacteria group; Actinobacteria; Actinomycetia; Streptosporangiales; Nocardiopsaceae; Streptomonospora; unclassified Streptomonospora
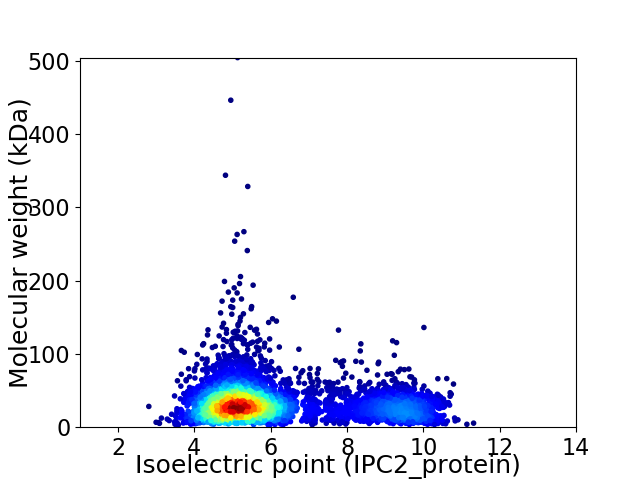
Average proteome isoelectric point is 6.12
Get precalculated fractions of proteins

Virtual 2D-PAGE plot for 5052 proteins (isoelectric point calculated using IPC2_protein)
Get csv file with sequences according to given criteria:
* You can choose from 21 different methods for calculating isoelectric point
Summary statistics related to proteome-wise predictions


Protein with the lowest isoelectric point:
>tr|A0A4V0ZJC5|A0A4V0ZJC5_9ACTN Glucosamine kinase GspK OS=Streptomonospora sp. M2 OX=2498135 GN=gspK PE=4 SV=1
MM1 pKa = 7.18NLARR5 pKa = 11.84RR6 pKa = 11.84IALIGGAAALASGFAVALPSEE27 pKa = 4.37PAEE30 pKa = 3.82AHH32 pKa = 6.37GGFTFPATRR41 pKa = 11.84TYY43 pKa = 11.43ACYY46 pKa = 10.32KK47 pKa = 10.54DD48 pKa = 4.53GIEE51 pKa = 4.41GGSGGSLNPQNPMCQQALAEE71 pKa = 4.04NSYY74 pKa = 11.03GFWNWFGNLISDD86 pKa = 3.54AGGRR90 pKa = 11.84HH91 pKa = 5.75RR92 pKa = 11.84EE93 pKa = 4.05IIPDD97 pKa = 3.75GKK99 pKa = 10.87LCGPTEE105 pKa = 4.0QFDD108 pKa = 3.92AFNAPGDD115 pKa = 3.73WPATEE120 pKa = 4.22VQSGDD125 pKa = 3.34TVTFEE130 pKa = 4.24HH131 pKa = 6.49NAWAAHH137 pKa = 6.6PGTFTQYY144 pKa = 8.42ITKK147 pKa = 10.42DD148 pKa = 3.07GWDD151 pKa = 3.56PSQPLGWDD159 pKa = 3.57DD160 pKa = 5.62LEE162 pKa = 4.35PAPFDD167 pKa = 3.98EE168 pKa = 4.74VTNPPKK174 pKa = 10.42RR175 pKa = 11.84SGGVEE180 pKa = 3.53GAEE183 pKa = 4.39YY184 pKa = 10.66YY185 pKa = 9.95WDD187 pKa = 3.26ATLPDD192 pKa = 3.24KK193 pKa = 10.96SGRR196 pKa = 11.84HH197 pKa = 5.2VIYY200 pKa = 10.47SIWQRR205 pKa = 11.84SDD207 pKa = 3.2SPEE210 pKa = 3.71AFYY213 pKa = 11.37NCSDD217 pKa = 4.02VIFGGDD223 pKa = 3.11GGDD226 pKa = 4.31NGNEE230 pKa = 4.87DD231 pKa = 3.88DD232 pKa = 4.48TQAPTAPGAPTADD245 pKa = 3.7SVSGDD250 pKa = 3.52AVDD253 pKa = 5.01LSWAASSDD261 pKa = 3.71NEE263 pKa = 4.07GVTRR267 pKa = 11.84YY268 pKa = 7.72EE269 pKa = 3.86VRR271 pKa = 11.84DD272 pKa = 3.41AATGEE277 pKa = 4.61TVATTSGATSATVGSLDD294 pKa = 3.9PEE296 pKa = 4.14TDD298 pKa = 3.17YY299 pKa = 11.79SFNVVALDD307 pKa = 3.69AAGNASDD314 pKa = 4.6ASPAVSVTTDD324 pKa = 3.04SADD327 pKa = 3.64NTSGACTVDD336 pKa = 3.66FTIANEE342 pKa = 3.84WSGGYY347 pKa = 8.7SANVEE352 pKa = 4.24LTNDD356 pKa = 3.38SDD358 pKa = 4.19SALSSWTVDD367 pKa = 2.78WEE369 pKa = 4.38FSDD372 pKa = 4.5GATVTNAWSADD383 pKa = 3.77VEE385 pKa = 4.25QHH387 pKa = 5.76EE388 pKa = 4.54AHH390 pKa = 6.4VMASNAGWNGSVPAGGSVSFGFNAEE415 pKa = 4.41TTGSAAAPEE424 pKa = 4.38EE425 pKa = 3.97FHH427 pKa = 7.46LDD429 pKa = 3.65GSPCSTAA436 pKa = 3.87
MM1 pKa = 7.18NLARR5 pKa = 11.84RR6 pKa = 11.84IALIGGAAALASGFAVALPSEE27 pKa = 4.37PAEE30 pKa = 3.82AHH32 pKa = 6.37GGFTFPATRR41 pKa = 11.84TYY43 pKa = 11.43ACYY46 pKa = 10.32KK47 pKa = 10.54DD48 pKa = 4.53GIEE51 pKa = 4.41GGSGGSLNPQNPMCQQALAEE71 pKa = 4.04NSYY74 pKa = 11.03GFWNWFGNLISDD86 pKa = 3.54AGGRR90 pKa = 11.84HH91 pKa = 5.75RR92 pKa = 11.84EE93 pKa = 4.05IIPDD97 pKa = 3.75GKK99 pKa = 10.87LCGPTEE105 pKa = 4.0QFDD108 pKa = 3.92AFNAPGDD115 pKa = 3.73WPATEE120 pKa = 4.22VQSGDD125 pKa = 3.34TVTFEE130 pKa = 4.24HH131 pKa = 6.49NAWAAHH137 pKa = 6.6PGTFTQYY144 pKa = 8.42ITKK147 pKa = 10.42DD148 pKa = 3.07GWDD151 pKa = 3.56PSQPLGWDD159 pKa = 3.57DD160 pKa = 5.62LEE162 pKa = 4.35PAPFDD167 pKa = 3.98EE168 pKa = 4.74VTNPPKK174 pKa = 10.42RR175 pKa = 11.84SGGVEE180 pKa = 3.53GAEE183 pKa = 4.39YY184 pKa = 10.66YY185 pKa = 9.95WDD187 pKa = 3.26ATLPDD192 pKa = 3.24KK193 pKa = 10.96SGRR196 pKa = 11.84HH197 pKa = 5.2VIYY200 pKa = 10.47SIWQRR205 pKa = 11.84SDD207 pKa = 3.2SPEE210 pKa = 3.71AFYY213 pKa = 11.37NCSDD217 pKa = 4.02VIFGGDD223 pKa = 3.11GGDD226 pKa = 4.31NGNEE230 pKa = 4.87DD231 pKa = 3.88DD232 pKa = 4.48TQAPTAPGAPTADD245 pKa = 3.7SVSGDD250 pKa = 3.52AVDD253 pKa = 5.01LSWAASSDD261 pKa = 3.71NEE263 pKa = 4.07GVTRR267 pKa = 11.84YY268 pKa = 7.72EE269 pKa = 3.86VRR271 pKa = 11.84DD272 pKa = 3.41AATGEE277 pKa = 4.61TVATTSGATSATVGSLDD294 pKa = 3.9PEE296 pKa = 4.14TDD298 pKa = 3.17YY299 pKa = 11.79SFNVVALDD307 pKa = 3.69AAGNASDD314 pKa = 4.6ASPAVSVTTDD324 pKa = 3.04SADD327 pKa = 3.64NTSGACTVDD336 pKa = 3.66FTIANEE342 pKa = 3.84WSGGYY347 pKa = 8.7SANVEE352 pKa = 4.24LTNDD356 pKa = 3.38SDD358 pKa = 4.19SALSSWTVDD367 pKa = 2.78WEE369 pKa = 4.38FSDD372 pKa = 4.5GATVTNAWSADD383 pKa = 3.77VEE385 pKa = 4.25QHH387 pKa = 5.76EE388 pKa = 4.54AHH390 pKa = 6.4VMASNAGWNGSVPAGGSVSFGFNAEE415 pKa = 4.41TTGSAAAPEE424 pKa = 4.38EE425 pKa = 3.97FHH427 pKa = 7.46LDD429 pKa = 3.65GSPCSTAA436 pKa = 3.87
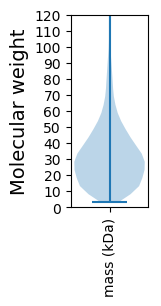
Molecular weight: 45.36 kDa
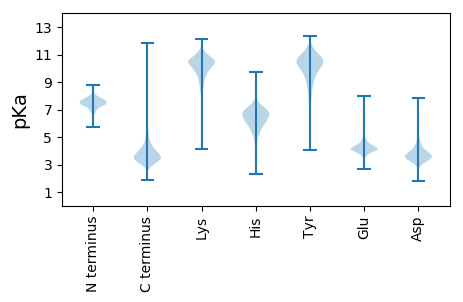
Isoelectric point according different methods:
Protein with the highest isoelectric point:
>tr|A0A4V0ZJ76|A0A4V0ZJ76_9ACTN Fructose-1 6-bisphosphatase OS=Streptomonospora sp. M2 OX=2498135 GN=glpX PE=3 SV=1
MM1 pKa = 7.69SKK3 pKa = 9.0RR4 pKa = 11.84TFQPNNRR11 pKa = 11.84RR12 pKa = 11.84RR13 pKa = 11.84AKK15 pKa = 9.45VHH17 pKa = 5.31GFRR20 pKa = 11.84LRR22 pKa = 11.84MRR24 pKa = 11.84TRR26 pKa = 11.84AGRR29 pKa = 11.84AVVAARR35 pKa = 11.84RR36 pKa = 11.84KK37 pKa = 9.55KK38 pKa = 9.79GRR40 pKa = 11.84ARR42 pKa = 11.84LTVSQQ47 pKa = 4.05
MM1 pKa = 7.69SKK3 pKa = 9.0RR4 pKa = 11.84TFQPNNRR11 pKa = 11.84RR12 pKa = 11.84RR13 pKa = 11.84AKK15 pKa = 9.45VHH17 pKa = 5.31GFRR20 pKa = 11.84LRR22 pKa = 11.84MRR24 pKa = 11.84TRR26 pKa = 11.84AGRR29 pKa = 11.84AVVAARR35 pKa = 11.84RR36 pKa = 11.84KK37 pKa = 9.55KK38 pKa = 9.79GRR40 pKa = 11.84ARR42 pKa = 11.84LTVSQQ47 pKa = 4.05
Molecular weight: 5.53 kDa
Isoelectric point according different methods:
Peptides (in silico digests for buttom-up proteomics)
Below you can find in silico digests of the whole proteome with Trypsin, Chymotrypsin, Trypsin+LysC, LysN, ArgC proteases suitable for different mass spec machines.| Try ESI |
 |
|---|
| ChTry ESI |
 |
|---|
| ArgC ESI |
 |
|---|
| LysN ESI |
 |
|---|
| TryLysC ESI |
 |
|---|
| Try MALDI |
 |
|---|
| ChTry MALDI |
 |
|---|
| ArgC MALDI |
 |
|---|
| LysN MALDI |
 |
|---|
| TryLysC MALDI |
 |
|---|
| Try LTQ |
 |
|---|
| ChTry LTQ |
 |
|---|
| ArgC LTQ |
 |
|---|
| LysN LTQ |
 |
|---|
| TryLysC LTQ |
 |
|---|
| Try MSlow |
 |
|---|
| ChTry MSlow |
 |
|---|
| ArgC MSlow |
 |
|---|
| LysN MSlow |
 |
|---|
| TryLysC MSlow |
 |
|---|
| Try MShigh |
 |
|---|
| ChTry MShigh |
 |
|---|
| ArgC MShigh |
 |
|---|
| LysN MShigh |
 |
|---|
| TryLysC MShigh |
 |
|---|
General Statistics
Number of major isoforms |
Number of additional isoforms |
Number of all proteins |
Number of amino acids |
Min. Seq. Length |
Max. Seq. Length |
Avg. Seq. Length |
Avg. Mol. Weight |
|---|---|---|---|---|---|---|---|
0 |
1614646 |
30 |
4798 |
319.6 |
34.16 |
Amino acid frequency
Ala |
Cys |
Asp |
Glu |
Phe |
Gly |
His |
Ile |
Lys |
Leu |
|---|---|---|---|---|---|---|---|---|---|
14.103 ± 0.066 | 0.807 ± 0.008 |
6.128 ± 0.032 | 6.36 ± 0.034 |
2.668 ± 0.018 | 9.749 ± 0.039 |
2.224 ± 0.016 | 3.152 ± 0.027 |
1.569 ± 0.023 | 9.801 ± 0.043 |
Met |
Asn |
Gln |
Pro |
Arg |
Ser |
Thr |
Val |
Trp |
Tyr |
|---|---|---|---|---|---|---|---|---|---|
1.853 ± 0.015 | 1.677 ± 0.018 |
6.187 ± 0.034 | 2.681 ± 0.022 |
8.636 ± 0.038 | 5.25 ± 0.027 |
5.475 ± 0.023 | 8.243 ± 0.038 |
1.452 ± 0.014 | 1.984 ± 0.017 |
Most of the basic statistics you can see at this page can be downloaded from this CSV file
Proteome-pI is available under Creative Commons Attribution-NoDerivs license, for more details see here
| Reference: Kozlowski LP. Proteome-pI 2.0: Proteome Isoelectric Point Database Update. Nucleic Acids Res. 2021, doi: 10.1093/nar/gkab944 | Contact: Lukasz P. Kozlowski |
