Microbacterium kyungheense
Taxonomy: cellular organisms; Bacteria; Terrabacteria group; Actinobacteria; Actinomycetia; Micrococcales; Microbacteriaceae; Microbacterium
Average proteome isoelectric point is 5.91
Get precalculated fractions of proteins

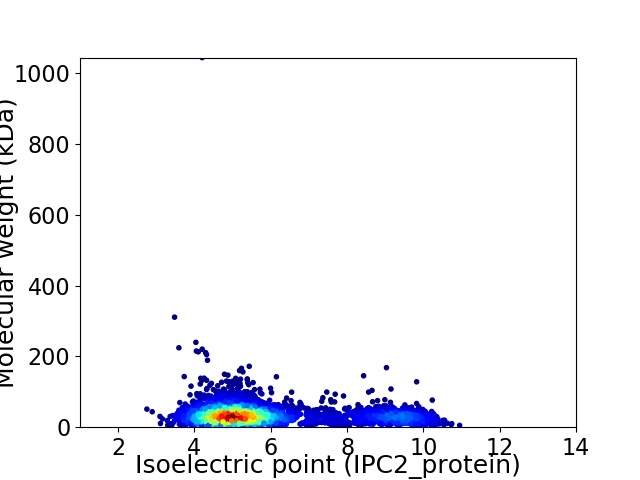
Virtual 2D-PAGE plot for 3787 proteins (isoelectric point calculated using IPC2_protein)
Get csv file with sequences according to given criteria:
* You can choose from 21 different methods for calculating isoelectric point
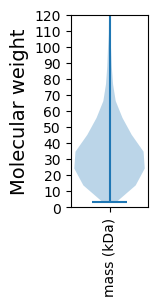
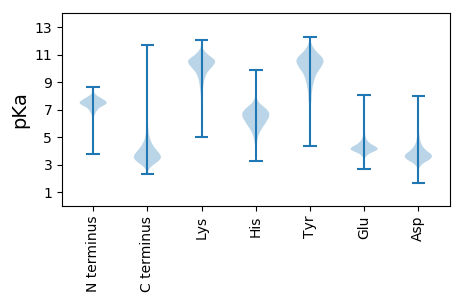
Summary statistics related to proteome-wise predictions


Protein with the lowest isoelectric point:
>tr|A0A543F2C1|A0A543F2C1_9MICO DNA-binding PadR family transcriptional regulator OS=Microbacterium kyungheense OX=1263636 GN=FB391_2035 PE=4 SV=1
MM1 pKa = 7.5PANRR5 pKa = 11.84LLGTVAVLALSALALTACAGSPEE28 pKa = 4.55ANPDD32 pKa = 3.43PTTSSVPTTAAPEE45 pKa = 4.21PSASAAPEE53 pKa = 4.04PTADD57 pKa = 4.17AAPTCEE63 pKa = 3.97TLISDD68 pKa = 4.42SLVADD73 pKa = 3.74YY74 pKa = 11.27EE75 pKa = 4.65KK76 pKa = 10.66IGVTAQEE83 pKa = 4.36SPFYY87 pKa = 10.46IAGQAIEE94 pKa = 4.49GGLRR98 pKa = 11.84CMWANFDD105 pKa = 4.24QPAGDD110 pKa = 3.63SGQIYY115 pKa = 9.9GWAKK119 pKa = 10.3MSDD122 pKa = 3.49ADD124 pKa = 5.34ADD126 pKa = 3.94AAQQALLAEE135 pKa = 4.53GWVRR139 pKa = 11.84EE140 pKa = 4.07DD141 pKa = 3.44AADD144 pKa = 3.62GGVYY148 pKa = 8.58ITEE151 pKa = 4.16SHH153 pKa = 6.7DD154 pKa = 3.5TAIVTDD160 pKa = 3.87DD161 pKa = 3.47EE162 pKa = 5.56GYY164 pKa = 11.44GMTYY168 pKa = 10.59LFAAGQVTVADD179 pKa = 4.34TKK181 pKa = 11.0QGLLLIEE188 pKa = 4.16WPKK191 pKa = 11.24AA192 pKa = 3.39
MM1 pKa = 7.5PANRR5 pKa = 11.84LLGTVAVLALSALALTACAGSPEE28 pKa = 4.55ANPDD32 pKa = 3.43PTTSSVPTTAAPEE45 pKa = 4.21PSASAAPEE53 pKa = 4.04PTADD57 pKa = 4.17AAPTCEE63 pKa = 3.97TLISDD68 pKa = 4.42SLVADD73 pKa = 3.74YY74 pKa = 11.27EE75 pKa = 4.65KK76 pKa = 10.66IGVTAQEE83 pKa = 4.36SPFYY87 pKa = 10.46IAGQAIEE94 pKa = 4.49GGLRR98 pKa = 11.84CMWANFDD105 pKa = 4.24QPAGDD110 pKa = 3.63SGQIYY115 pKa = 9.9GWAKK119 pKa = 10.3MSDD122 pKa = 3.49ADD124 pKa = 5.34ADD126 pKa = 3.94AAQQALLAEE135 pKa = 4.53GWVRR139 pKa = 11.84EE140 pKa = 4.07DD141 pKa = 3.44AADD144 pKa = 3.62GGVYY148 pKa = 8.58ITEE151 pKa = 4.16SHH153 pKa = 6.7DD154 pKa = 3.5TAIVTDD160 pKa = 3.87DD161 pKa = 3.47EE162 pKa = 5.56GYY164 pKa = 11.44GMTYY168 pKa = 10.59LFAAGQVTVADD179 pKa = 4.34TKK181 pKa = 11.0QGLLLIEE188 pKa = 4.16WPKK191 pKa = 11.24AA192 pKa = 3.39
Molecular weight: 19.77 kDa
Isoelectric point according different methods:
Protein with the highest isoelectric point:
>tr|A0A543EAU7|A0A543EAU7_9MICO Two-component system sensor histidine kinase DesK OS=Microbacterium kyungheense OX=1263636 GN=FB391_3852 PE=4 SV=1
MM1 pKa = 7.69SKK3 pKa = 9.0RR4 pKa = 11.84TFQPNNRR11 pKa = 11.84RR12 pKa = 11.84RR13 pKa = 11.84AKK15 pKa = 10.04KK16 pKa = 8.86HH17 pKa = 4.36GFRR20 pKa = 11.84ARR22 pKa = 11.84MRR24 pKa = 11.84TRR26 pKa = 11.84AGRR29 pKa = 11.84SILSARR35 pKa = 11.84RR36 pKa = 11.84AKK38 pKa = 10.56GRR40 pKa = 11.84TEE42 pKa = 4.14LSAA45 pKa = 4.86
MM1 pKa = 7.69SKK3 pKa = 9.0RR4 pKa = 11.84TFQPNNRR11 pKa = 11.84RR12 pKa = 11.84RR13 pKa = 11.84AKK15 pKa = 10.04KK16 pKa = 8.86HH17 pKa = 4.36GFRR20 pKa = 11.84ARR22 pKa = 11.84MRR24 pKa = 11.84TRR26 pKa = 11.84AGRR29 pKa = 11.84SILSARR35 pKa = 11.84RR36 pKa = 11.84AKK38 pKa = 10.56GRR40 pKa = 11.84TEE42 pKa = 4.14LSAA45 pKa = 4.86
Molecular weight: 5.27 kDa
Isoelectric point according different methods:
Peptides (in silico digests for buttom-up proteomics)
Below you can find in silico digests of the whole proteome with Trypsin, Chymotrypsin, Trypsin+LysC, LysN, ArgC proteases suitable for different mass spec machines.| Try ESI |
 |
|---|
| ChTry ESI |
 |
|---|
| ArgC ESI |
 |
|---|
| LysN ESI |
 |
|---|
| TryLysC ESI |
 |
|---|
| Try MALDI |
 |
|---|
| ChTry MALDI |
 |
|---|
| ArgC MALDI |
 |
|---|
| LysN MALDI |
 |
|---|
| TryLysC MALDI |
 |
|---|
| Try LTQ |
 |
|---|
| ChTry LTQ |
 |
|---|
| ArgC LTQ |
 |
|---|
| LysN LTQ |
 |
|---|
| TryLysC LTQ |
 |
|---|
| Try MSlow |
 |
|---|
| ChTry MSlow |
 |
|---|
| ArgC MSlow |
 |
|---|
| LysN MSlow |
 |
|---|
| TryLysC MSlow |
 |
|---|
| Try MShigh |
 |
|---|
| ChTry MShigh |
 |
|---|
| ArgC MShigh |
 |
|---|
| LysN MShigh |
 |
|---|
| TryLysC MShigh |
 |
|---|
General Statistics
Number of major isoforms |
Number of additional isoforms |
Number of all proteins |
Number of amino acids |
Min. Seq. Length |
Max. Seq. Length |
Avg. Seq. Length |
Avg. Mol. Weight |
|---|---|---|---|---|---|---|---|
0 |
1287887 |
26 |
10898 |
340.1 |
36.28 |
Amino acid frequency
Ala |
Cys |
Asp |
Glu |
Phe |
Gly |
His |
Ile |
Lys |
Leu |
|---|---|---|---|---|---|---|---|---|---|
14.159 ± 0.09 | 0.467 ± 0.01 |
6.595 ± 0.04 | 5.423 ± 0.045 |
3.126 ± 0.026 | 9.062 ± 0.054 |
1.951 ± 0.018 | 4.278 ± 0.027 |
1.734 ± 0.028 | 9.883 ± 0.057 |
Met |
Asn |
Gln |
Pro |
Arg |
Ser |
Thr |
Val |
Trp |
Tyr |
|---|---|---|---|---|---|---|---|---|---|
1.705 ± 0.019 | 1.811 ± 0.023 |
5.589 ± 0.035 | 2.68 ± 0.022 |
7.31 ± 0.064 | 5.318 ± 0.04 |
6.09 ± 0.062 | 9.155 ± 0.038 |
1.636 ± 0.02 | 2.028 ± 0.023 |
Most of the basic statistics you can see at this page can be downloaded from this CSV file
Proteome-pI is available under Creative Commons Attribution-NoDerivs license, for more details see here
| Reference: Kozlowski LP. Proteome-pI 2.0: Proteome Isoelectric Point Database Update. Nucleic Acids Res. 2021, doi: 10.1093/nar/gkab944 | Contact: Lukasz P. Kozlowski |
