Euroglyphus maynei (Mayne s house dust mite)
Taxonomy: cellular organisms; Eukaryota; Opisthokonta; Metazoa; Eumetazoa; Bilateria; Protostomia; Ecdysozoa; Panarthropoda; Arthropoda; Chelicerata; Arachnida; Acari; Acariformes; Sarcoptiformes; Astigmata; Psoroptidia; Analgoidea; Pyroglyphidae; Pyroglyphinae; Euroglyphus
Average proteome isoelectric point is 6.74
Get precalculated fractions of proteins

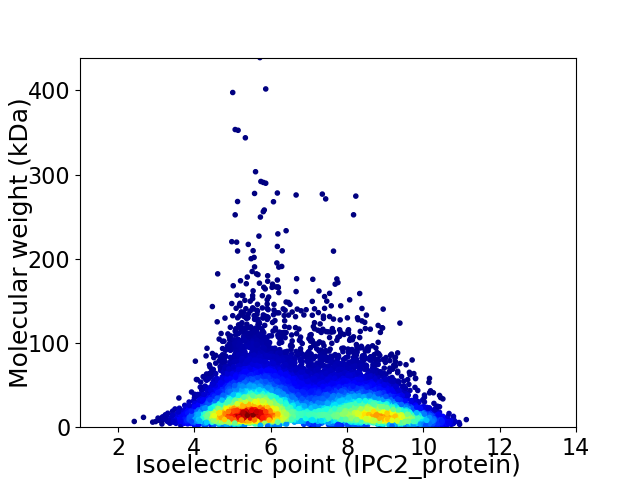
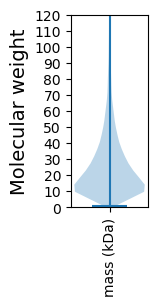
Virtual 2D-PAGE plot for 15246 proteins (isoelectric point calculated using IPC2_protein)
Get csv file with sequences according to given criteria:
* You can choose from 21 different methods for calculating isoelectric point
Summary statistics related to proteome-wise predictions


Protein with the lowest isoelectric point:
>tr|A0A1Y3AXG1|A0A1Y3AXG1_EURMA Uncharacterized protein OS=Euroglyphus maynei OX=6958 GN=BLA29_013588 PE=4 SV=1
MM1 pKa = 7.57SSLKK5 pKa = 9.72RR6 pKa = 11.84TFDD9 pKa = 3.5QIDD12 pKa = 3.84PQPSDD17 pKa = 3.81DD18 pKa = 3.6QHH20 pKa = 6.6EE21 pKa = 4.55SSEE24 pKa = 4.25DD25 pKa = 3.14HH26 pKa = 6.79HH27 pKa = 6.53QQQQQSNDD35 pKa = 3.5DD36 pKa = 3.69CDD38 pKa = 5.39KK39 pKa = 11.07IIATEE44 pKa = 4.27MIDD47 pKa = 3.3HH48 pKa = 7.02QYY50 pKa = 9.63YY51 pKa = 9.01QHH53 pKa = 6.92NDD55 pKa = 3.04DD56 pKa = 5.64DD57 pKa = 6.51AIVDD61 pKa = 3.99DD62 pKa = 5.27NEE64 pKa = 4.17PAMKK68 pKa = 10.35LMKK71 pKa = 9.88IDD73 pKa = 4.62DD74 pKa = 4.19NNHH77 pKa = 5.37YY78 pKa = 10.55LIDD81 pKa = 4.13SSTSPLLLLSPQPPPEE97 pKa = 4.46SPPPEE102 pKa = 6.14LIDD105 pKa = 4.03KK106 pKa = 9.58CIQVDD111 pKa = 3.9TNAITEE117 pKa = 4.63DD118 pKa = 3.63IVTEE122 pKa = 4.18SAITTCYY129 pKa = 10.49DD130 pKa = 3.11INDD133 pKa = 3.98DD134 pKa = 3.77HH135 pKa = 6.78HH136 pKa = 7.7HH137 pKa = 6.75HH138 pKa = 6.12EE139 pKa = 4.5VIEE142 pKa = 4.2IEE144 pKa = 4.47LNSSSLNPEE153 pKa = 3.76QQQQQNDD160 pKa = 3.8SLTEE164 pKa = 3.84NSCQNDD170 pKa = 3.43QQQQLPEE177 pKa = 4.11DD178 pKa = 3.62QQ179 pKa = 4.03
MM1 pKa = 7.57SSLKK5 pKa = 9.72RR6 pKa = 11.84TFDD9 pKa = 3.5QIDD12 pKa = 3.84PQPSDD17 pKa = 3.81DD18 pKa = 3.6QHH20 pKa = 6.6EE21 pKa = 4.55SSEE24 pKa = 4.25DD25 pKa = 3.14HH26 pKa = 6.79HH27 pKa = 6.53QQQQQSNDD35 pKa = 3.5DD36 pKa = 3.69CDD38 pKa = 5.39KK39 pKa = 11.07IIATEE44 pKa = 4.27MIDD47 pKa = 3.3HH48 pKa = 7.02QYY50 pKa = 9.63YY51 pKa = 9.01QHH53 pKa = 6.92NDD55 pKa = 3.04DD56 pKa = 5.64DD57 pKa = 6.51AIVDD61 pKa = 3.99DD62 pKa = 5.27NEE64 pKa = 4.17PAMKK68 pKa = 10.35LMKK71 pKa = 9.88IDD73 pKa = 4.62DD74 pKa = 4.19NNHH77 pKa = 5.37YY78 pKa = 10.55LIDD81 pKa = 4.13SSTSPLLLLSPQPPPEE97 pKa = 4.46SPPPEE102 pKa = 6.14LIDD105 pKa = 4.03KK106 pKa = 9.58CIQVDD111 pKa = 3.9TNAITEE117 pKa = 4.63DD118 pKa = 3.63IVTEE122 pKa = 4.18SAITTCYY129 pKa = 10.49DD130 pKa = 3.11INDD133 pKa = 3.98DD134 pKa = 3.77HH135 pKa = 6.78HH136 pKa = 7.7HH137 pKa = 6.75HH138 pKa = 6.12EE139 pKa = 4.5VIEE142 pKa = 4.2IEE144 pKa = 4.47LNSSSLNPEE153 pKa = 3.76QQQQQNDD160 pKa = 3.8SLTEE164 pKa = 3.84NSCQNDD170 pKa = 3.43QQQQLPEE177 pKa = 4.11DD178 pKa = 3.62QQ179 pKa = 4.03
Molecular weight: 20.5 kDa
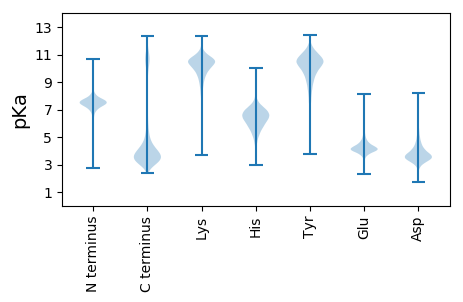
Isoelectric point according different methods:
Protein with the highest isoelectric point:
>tr|A0A1Y3BMI7|A0A1Y3BMI7_EURMA Calcium-independent phospholipase A2-gamma-like protein (Fragment) OS=Euroglyphus maynei OX=6958 GN=BLA29_009093 PE=4 SV=1
DDD2 pKa = 4.18QKKK5 pKa = 10.86LPLSRR10 pKa = 11.84FLGPQGGGKKK20 pKa = 9.89GGSGRR25 pKa = 11.84GGSRR29 pKa = 11.84GGRR32 pKa = 11.84AGGFGRR38 pKa = 11.84GGGGFGNRR46 pKa = 11.84GRR48 pKa = 11.84GNRR51 pKa = 11.84GGGFSSRR58 pKa = 11.84GGGSFGGRR66 pKa = 11.84GGGGRR71 pKa = 11.84GGSFGGNRR79 pKa = 11.84GRR81 pKa = 11.84GGGGFRR87 pKa = 11.84GGFRR91 pKa = 11.84GGRR94 pKa = 11.84RR95 pKa = 11.84
DDD2 pKa = 4.18QKKK5 pKa = 10.86LPLSRR10 pKa = 11.84FLGPQGGGKKK20 pKa = 9.89GGSGRR25 pKa = 11.84GGSRR29 pKa = 11.84GGRR32 pKa = 11.84AGGFGRR38 pKa = 11.84GGGGFGNRR46 pKa = 11.84GRR48 pKa = 11.84GNRR51 pKa = 11.84GGGFSSRR58 pKa = 11.84GGGSFGGRR66 pKa = 11.84GGGGRR71 pKa = 11.84GGSFGGNRR79 pKa = 11.84GRR81 pKa = 11.84GGGGFRR87 pKa = 11.84GGFRR91 pKa = 11.84GGRR94 pKa = 11.84RR95 pKa = 11.84
Molecular weight: 9.03 kDa
Isoelectric point according different methods:
Peptides (in silico digests for buttom-up proteomics)
Below you can find in silico digests of the whole proteome with Trypsin, Chymotrypsin, Trypsin+LysC, LysN, ArgC proteases suitable for different mass spec machines.| Try ESI |
 |
|---|
| ChTry ESI |
 |
|---|
| ArgC ESI |
 |
|---|
| LysN ESI |
 |
|---|
| TryLysC ESI |
 |
|---|
| Try MALDI |
 |
|---|
| ChTry MALDI |
 |
|---|
| ArgC MALDI |
 |
|---|
| LysN MALDI |
 |
|---|
| TryLysC MALDI |
 |
|---|
| Try LTQ |
 |
|---|
| ChTry LTQ |
 |
|---|
| ArgC LTQ |
 |
|---|
| LysN LTQ |
 |
|---|
| TryLysC LTQ |
 |
|---|
| Try MSlow |
 |
|---|
| ChTry MSlow |
 |
|---|
| ArgC MSlow |
 |
|---|
| LysN MSlow |
 |
|---|
| TryLysC MSlow |
 |
|---|
| Try MShigh |
 |
|---|
| ChTry MShigh |
 |
|---|
| ArgC MShigh |
 |
|---|
| LysN MShigh |
 |
|---|
| TryLysC MShigh |
 |
|---|
General Statistics
Number of major isoforms |
Number of additional isoforms |
Number of all proteins |
Number of amino acids |
Min. Seq. Length |
Max. Seq. Length |
Avg. Seq. Length |
Avg. Mol. Weight |
|---|---|---|---|---|---|---|---|
0 |
3727433 |
8 |
3959 |
244.5 |
27.94 |
Amino acid frequency
Ala |
Cys |
Asp |
Glu |
Phe |
Gly |
His |
Ile |
Lys |
Leu |
|---|---|---|---|---|---|---|---|---|---|
4.828 ± 0.021 | 1.876 ± 0.017 |
5.857 ± 0.018 | 5.849 ± 0.022 |
4.464 ± 0.019 | 4.696 ± 0.022 |
2.763 ± 0.013 | 7.496 ± 0.022 |
6.223 ± 0.022 | 8.947 ± 0.027 |
Met |
Asn |
Gln |
Pro |
Arg |
Ser |
Thr |
Val |
Trp |
Tyr |
|---|---|---|---|---|---|---|---|---|---|
2.676 ± 0.011 | 6.78 ± 0.022 |
4.31 ± 0.024 | 4.917 ± 0.024 |
5.12 ± 0.018 | 8.295 ± 0.031 |
5.495 ± 0.021 | 4.929 ± 0.017 |
1.007 ± 0.007 | 3.465 ± 0.013 |
Most of the basic statistics you can see at this page can be downloaded from this CSV file
Proteome-pI is available under Creative Commons Attribution-NoDerivs license, for more details see here
| Reference: Kozlowski LP. Proteome-pI 2.0: Proteome Isoelectric Point Database Update. Nucleic Acids Res. 2021, doi: 10.1093/nar/gkab944 | Contact: Lukasz P. Kozlowski |
