Hahella chejuensis (strain KCTC 2396)
Taxonomy: cellular organisms; Bacteria; Proteobacteria; Gammaproteobacteria; Oceanospirillales; Hahellaceae; Hahella; Hahella chejuensis
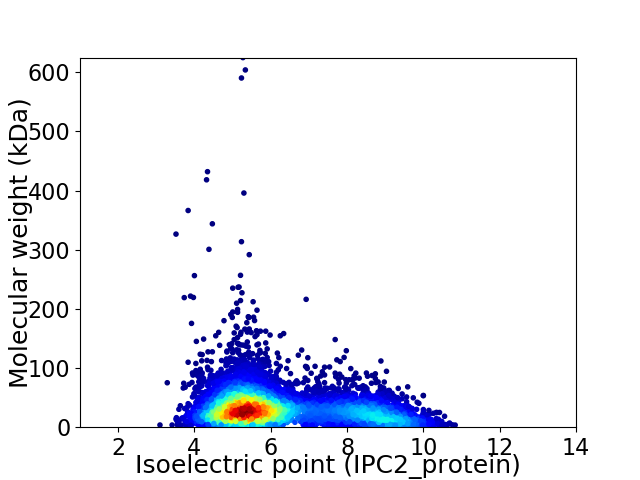
Average proteome isoelectric point is 6.26
Get precalculated fractions of proteins

Virtual 2D-PAGE plot for 6751 proteins (isoelectric point calculated using IPC2_protein)
Get csv file with sequences according to given criteria:
* You can choose from 21 different methods for calculating isoelectric point
Summary statistics related to proteome-wise predictions


Protein with the lowest isoelectric point:
>tr|Q2SI75|Q2SI75_HAHCH Uncharacterized protein OS=Hahella chejuensis (strain KCTC 2396) OX=349521 GN=HCH_02873 PE=4 SV=1
MM1 pKa = 7.83PEE3 pKa = 3.69YY4 pKa = 10.41GYY6 pKa = 10.82HH7 pKa = 5.83NEE9 pKa = 4.16SFASVLFIQAGKK21 pKa = 8.22AQSMAVGDD29 pKa = 4.08VFFLNPGDD37 pKa = 4.24SVDD40 pKa = 4.26EE41 pKa = 4.36IYY43 pKa = 10.98AALKK47 pKa = 9.8AASGTSNGRR56 pKa = 11.84IGLYY60 pKa = 9.63ICAADD65 pKa = 4.34KK66 pKa = 10.86LPQVGASPVRR76 pKa = 11.84YY77 pKa = 9.04IDD79 pKa = 3.53IPTISTAGAVYY90 pKa = 10.26GGAITPYY97 pKa = 10.13VEE99 pKa = 3.85PAGAGSFCAIVAGAIPGTSNTNLNAAKK126 pKa = 10.11HH127 pKa = 5.71PSDD130 pKa = 3.46VVTSSVCNSGVGVWVRR146 pKa = 11.84DD147 pKa = 3.59SEE149 pKa = 5.03DD150 pKa = 3.8PDD152 pKa = 4.67RR153 pKa = 11.84LAAWAIVTLSSTPSPSISGLVGGNASTQYY182 pKa = 11.33GDD184 pKa = 3.18EE185 pKa = 4.31TANVTDD191 pKa = 4.5FSEE194 pKa = 4.95TITSGYY200 pKa = 7.64LTPDD204 pKa = 3.26AGSTQYY210 pKa = 12.03ALLDD214 pKa = 3.55VTDD217 pKa = 4.43NLDD220 pKa = 3.21GTVDD224 pKa = 3.5YY225 pKa = 10.28RR226 pKa = 11.84SPGDD230 pKa = 3.63APTSAVDD237 pKa = 3.96LVLSGASEE245 pKa = 4.29SATLAGVAHH254 pKa = 6.44TQTHH258 pKa = 5.77TAQFPAPGTNADD270 pKa = 4.49DD271 pKa = 3.99NSFAAGQGGGNNPWFEE287 pKa = 4.22PPAFPLADD295 pKa = 3.39TTATYY300 pKa = 11.37DD301 pKa = 3.65LVFKK305 pKa = 10.71DD306 pKa = 4.05GVSAITTANIVLDD319 pKa = 3.89VNDD322 pKa = 3.45VVEE325 pKa = 4.67AEE327 pKa = 4.28EE328 pKa = 4.39GTPAGTTFQVTFQKK342 pKa = 10.39IYY344 pKa = 10.95DD345 pKa = 4.43DD346 pKa = 3.92GTTASWTVTLTVGEE360 pKa = 4.63DD361 pKa = 3.35GSLEE365 pKa = 4.0VDD367 pKa = 3.95SIMGPVFKK375 pKa = 10.66DD376 pKa = 2.58IFRR379 pKa = 11.84PVFRR383 pKa = 11.84EE384 pKa = 4.05VAA386 pKa = 3.32
MM1 pKa = 7.83PEE3 pKa = 3.69YY4 pKa = 10.41GYY6 pKa = 10.82HH7 pKa = 5.83NEE9 pKa = 4.16SFASVLFIQAGKK21 pKa = 8.22AQSMAVGDD29 pKa = 4.08VFFLNPGDD37 pKa = 4.24SVDD40 pKa = 4.26EE41 pKa = 4.36IYY43 pKa = 10.98AALKK47 pKa = 9.8AASGTSNGRR56 pKa = 11.84IGLYY60 pKa = 9.63ICAADD65 pKa = 4.34KK66 pKa = 10.86LPQVGASPVRR76 pKa = 11.84YY77 pKa = 9.04IDD79 pKa = 3.53IPTISTAGAVYY90 pKa = 10.26GGAITPYY97 pKa = 10.13VEE99 pKa = 3.85PAGAGSFCAIVAGAIPGTSNTNLNAAKK126 pKa = 10.11HH127 pKa = 5.71PSDD130 pKa = 3.46VVTSSVCNSGVGVWVRR146 pKa = 11.84DD147 pKa = 3.59SEE149 pKa = 5.03DD150 pKa = 3.8PDD152 pKa = 4.67RR153 pKa = 11.84LAAWAIVTLSSTPSPSISGLVGGNASTQYY182 pKa = 11.33GDD184 pKa = 3.18EE185 pKa = 4.31TANVTDD191 pKa = 4.5FSEE194 pKa = 4.95TITSGYY200 pKa = 7.64LTPDD204 pKa = 3.26AGSTQYY210 pKa = 12.03ALLDD214 pKa = 3.55VTDD217 pKa = 4.43NLDD220 pKa = 3.21GTVDD224 pKa = 3.5YY225 pKa = 10.28RR226 pKa = 11.84SPGDD230 pKa = 3.63APTSAVDD237 pKa = 3.96LVLSGASEE245 pKa = 4.29SATLAGVAHH254 pKa = 6.44TQTHH258 pKa = 5.77TAQFPAPGTNADD270 pKa = 4.49DD271 pKa = 3.99NSFAAGQGGGNNPWFEE287 pKa = 4.22PPAFPLADD295 pKa = 3.39TTATYY300 pKa = 11.37DD301 pKa = 3.65LVFKK305 pKa = 10.71DD306 pKa = 4.05GVSAITTANIVLDD319 pKa = 3.89VNDD322 pKa = 3.45VVEE325 pKa = 4.67AEE327 pKa = 4.28EE328 pKa = 4.39GTPAGTTFQVTFQKK342 pKa = 10.39IYY344 pKa = 10.95DD345 pKa = 4.43DD346 pKa = 3.92GTTASWTVTLTVGEE360 pKa = 4.63DD361 pKa = 3.35GSLEE365 pKa = 4.0VDD367 pKa = 3.95SIMGPVFKK375 pKa = 10.66DD376 pKa = 2.58IFRR379 pKa = 11.84PVFRR383 pKa = 11.84EE384 pKa = 4.05VAA386 pKa = 3.32
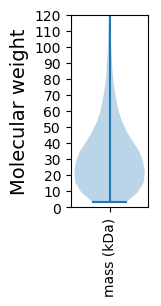
Molecular weight: 39.73 kDa
Isoelectric point according different methods:
Protein with the highest isoelectric point:
>tr|Q2SHB7|Q2SHB7_HAHCH Transposase and inactivated derivatives OS=Hahella chejuensis (strain KCTC 2396) OX=349521 GN=HCH_03196 PE=4 SV=1
MM1 pKa = 7.2TSWRR5 pKa = 11.84PLQTPGPRR13 pKa = 11.84GASVSRR19 pKa = 11.84LWISHH24 pKa = 5.49IFRR27 pKa = 11.84VKK29 pKa = 9.53RR30 pKa = 11.84TT31 pKa = 3.39
MM1 pKa = 7.2TSWRR5 pKa = 11.84PLQTPGPRR13 pKa = 11.84GASVSRR19 pKa = 11.84LWISHH24 pKa = 5.49IFRR27 pKa = 11.84VKK29 pKa = 9.53RR30 pKa = 11.84TT31 pKa = 3.39
Molecular weight: 3.62 kDa
Isoelectric point according different methods:
Peptides (in silico digests for buttom-up proteomics)
Below you can find in silico digests of the whole proteome with Trypsin, Chymotrypsin, Trypsin+LysC, LysN, ArgC proteases suitable for different mass spec machines.| Try ESI |
 |
|---|
| ChTry ESI |
 |
|---|
| ArgC ESI |
 |
|---|
| LysN ESI |
 |
|---|
| TryLysC ESI |
 |
|---|
| Try MALDI |
 |
|---|
| ChTry MALDI |
 |
|---|
| ArgC MALDI |
 |
|---|
| LysN MALDI |
 |
|---|
| TryLysC MALDI |
 |
|---|
| Try LTQ |
 |
|---|
| ChTry LTQ |
 |
|---|
| ArgC LTQ |
 |
|---|
| LysN LTQ |
 |
|---|
| TryLysC LTQ |
 |
|---|
| Try MSlow |
 |
|---|
| ChTry MSlow |
 |
|---|
| ArgC MSlow |
 |
|---|
| LysN MSlow |
 |
|---|
| TryLysC MSlow |
 |
|---|
| Try MShigh |
 |
|---|
| ChTry MShigh |
 |
|---|
| ArgC MShigh |
 |
|---|
| LysN MShigh |
 |
|---|
| TryLysC MShigh |
 |
|---|
General Statistics
Number of major isoforms |
Number of additional isoforms |
Number of all proteins |
Number of amino acids |
Min. Seq. Length |
Max. Seq. Length |
Avg. Seq. Length |
Avg. Mol. Weight |
|---|---|---|---|---|---|---|---|
0 |
2111145 |
29 |
5711 |
312.7 |
34.66 |
Amino acid frequency
Ala |
Cys |
Asp |
Glu |
Phe |
Gly |
His |
Ile |
Lys |
Leu |
|---|---|---|---|---|---|---|---|---|---|
9.734 ± 0.037 | 1.047 ± 0.012 |
5.733 ± 0.031 | 6.419 ± 0.031 |
3.902 ± 0.02 | 7.296 ± 0.039 |
2.162 ± 0.015 | 5.365 ± 0.027 |
4.465 ± 0.028 | 10.541 ± 0.042 |
Met |
Asn |
Gln |
Pro |
Arg |
Ser |
Thr |
Val |
Trp |
Tyr |
|---|---|---|---|---|---|---|---|---|---|
2.445 ± 0.018 | 3.615 ± 0.022 |
4.442 ± 0.024 | 4.227 ± 0.023 |
5.916 ± 0.028 | 6.481 ± 0.029 |
4.899 ± 0.032 | 6.822 ± 0.031 |
1.39 ± 0.014 | 3.098 ± 0.021 |
Most of the basic statistics you can see at this page can be downloaded from this CSV file
Proteome-pI is available under Creative Commons Attribution-NoDerivs license, for more details see here
| Reference: Kozlowski LP. Proteome-pI 2.0: Proteome Isoelectric Point Database Update. Nucleic Acids Res. 2021, doi: 10.1093/nar/gkab944 | Contact: Lukasz P. Kozlowski |
