Vagococcus salmoninarum
Taxonomy: cellular organisms; Bacteria; Terrabacteria group; Firmicutes; Bacilli; Lactobacillales; Enterococcaceae;
Average proteome isoelectric point is 6.13
Get precalculated fractions of proteins

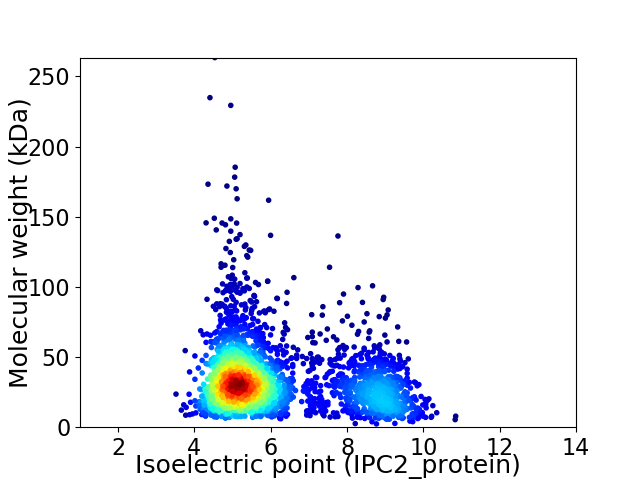
Virtual 2D-PAGE plot for 2859 proteins (isoelectric point calculated using IPC2_protein)
Get csv file with sequences according to given criteria:
* You can choose from 21 different methods for calculating isoelectric point
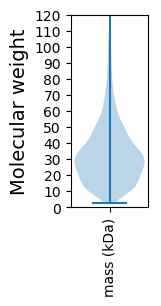
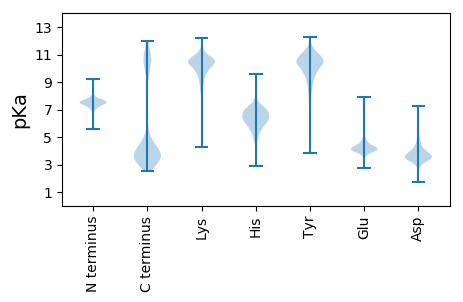
Summary statistics related to proteome-wise predictions


Protein with the lowest isoelectric point:
>tr|A0A429ZV08|A0A429ZV08_9ENTE QacE family quaternary ammonium compound efflux SMR transporter OS=Vagococcus salmoninarum OX=2739 GN=CBF35_02435 PE=3 SV=1
MM1 pKa = 7.04NVKK4 pKa = 9.08TKK6 pKa = 10.78LVGIVAIATTTMGFGATAFADD27 pKa = 3.52SIYY30 pKa = 9.89TVKK33 pKa = 10.85SGDD36 pKa = 3.62TLSQISYY43 pKa = 10.16DD44 pKa = 3.94YY45 pKa = 11.04LGSADD50 pKa = 3.82QYY52 pKa = 8.81TTIAQSNNILNADD65 pKa = 4.97LIYY68 pKa = 10.83VGQKK72 pKa = 10.49LKK74 pKa = 11.08LSADD78 pKa = 3.84GQISEE83 pKa = 4.27ATADD87 pKa = 3.52EE88 pKa = 4.39VATIEE93 pKa = 4.25EE94 pKa = 4.39ATTPVIEE101 pKa = 4.4EE102 pKa = 3.86NTPVVEE108 pKa = 4.15EE109 pKa = 4.34TPAVVEE115 pKa = 4.14EE116 pKa = 4.57APVAEE121 pKa = 4.32PVQEE125 pKa = 4.12VEE127 pKa = 4.48QVQEE131 pKa = 3.98SAPAGRR137 pKa = 11.84TITVEE142 pKa = 3.76TTAYY146 pKa = 10.61DD147 pKa = 4.63GISLGGLTATGYY159 pKa = 10.79QITGYY164 pKa = 8.82GDD166 pKa = 3.15KK167 pKa = 10.92VIAVDD172 pKa = 4.11PNVIPLGSTVYY183 pKa = 10.49VPGYY187 pKa = 8.3GTAIAADD194 pKa = 3.65TGGAIQGNIIDD205 pKa = 5.24LNMSTADD212 pKa = 3.85AIQWGRR218 pKa = 11.84RR219 pKa = 11.84SVTITILL226 pKa = 3.4
MM1 pKa = 7.04NVKK4 pKa = 9.08TKK6 pKa = 10.78LVGIVAIATTTMGFGATAFADD27 pKa = 3.52SIYY30 pKa = 9.89TVKK33 pKa = 10.85SGDD36 pKa = 3.62TLSQISYY43 pKa = 10.16DD44 pKa = 3.94YY45 pKa = 11.04LGSADD50 pKa = 3.82QYY52 pKa = 8.81TTIAQSNNILNADD65 pKa = 4.97LIYY68 pKa = 10.83VGQKK72 pKa = 10.49LKK74 pKa = 11.08LSADD78 pKa = 3.84GQISEE83 pKa = 4.27ATADD87 pKa = 3.52EE88 pKa = 4.39VATIEE93 pKa = 4.25EE94 pKa = 4.39ATTPVIEE101 pKa = 4.4EE102 pKa = 3.86NTPVVEE108 pKa = 4.15EE109 pKa = 4.34TPAVVEE115 pKa = 4.14EE116 pKa = 4.57APVAEE121 pKa = 4.32PVQEE125 pKa = 4.12VEE127 pKa = 4.48QVQEE131 pKa = 3.98SAPAGRR137 pKa = 11.84TITVEE142 pKa = 3.76TTAYY146 pKa = 10.61DD147 pKa = 4.63GISLGGLTATGYY159 pKa = 10.79QITGYY164 pKa = 8.82GDD166 pKa = 3.15KK167 pKa = 10.92VIAVDD172 pKa = 4.11PNVIPLGSTVYY183 pKa = 10.49VPGYY187 pKa = 8.3GTAIAADD194 pKa = 3.65TGGAIQGNIIDD205 pKa = 5.24LNMSTADD212 pKa = 3.85AIQWGRR218 pKa = 11.84RR219 pKa = 11.84SVTITILL226 pKa = 3.4
Molecular weight: 23.5 kDa
Isoelectric point according different methods:
Protein with the highest isoelectric point:
>tr|A0A429ZIJ5|A0A429ZIJ5_9ENTE Aldo/keto reductase OS=Vagococcus salmoninarum OX=2739 GN=CBF35_11335 PE=4 SV=1
MM1 pKa = 7.13AQQRR5 pKa = 11.84RR6 pKa = 11.84GGKK9 pKa = 8.91RR10 pKa = 11.84RR11 pKa = 11.84RR12 pKa = 11.84KK13 pKa = 9.35VCYY16 pKa = 9.34FCANHH21 pKa = 6.06VDD23 pKa = 3.4HH24 pKa = 7.29VDD26 pKa = 3.68YY27 pKa = 11.34KK28 pKa = 11.16DD29 pKa = 3.67VEE31 pKa = 4.32LLKK34 pKa = 11.01SRR36 pKa = 11.84FISEE40 pKa = 3.98RR41 pKa = 11.84GKK43 pKa = 9.78ILPRR47 pKa = 11.84RR48 pKa = 11.84VTGTCAKK55 pKa = 9.69HH56 pKa = 5.69QRR58 pKa = 11.84TLTVAIKK65 pKa = 10.14RR66 pKa = 11.84ARR68 pKa = 11.84IMGLLPFVGEE78 pKa = 4.26EE79 pKa = 3.86QQ80 pKa = 3.46
MM1 pKa = 7.13AQQRR5 pKa = 11.84RR6 pKa = 11.84GGKK9 pKa = 8.91RR10 pKa = 11.84RR11 pKa = 11.84RR12 pKa = 11.84KK13 pKa = 9.35VCYY16 pKa = 9.34FCANHH21 pKa = 6.06VDD23 pKa = 3.4HH24 pKa = 7.29VDD26 pKa = 3.68YY27 pKa = 11.34KK28 pKa = 11.16DD29 pKa = 3.67VEE31 pKa = 4.32LLKK34 pKa = 11.01SRR36 pKa = 11.84FISEE40 pKa = 3.98RR41 pKa = 11.84GKK43 pKa = 9.78ILPRR47 pKa = 11.84RR48 pKa = 11.84VTGTCAKK55 pKa = 9.69HH56 pKa = 5.69QRR58 pKa = 11.84TLTVAIKK65 pKa = 10.14RR66 pKa = 11.84ARR68 pKa = 11.84IMGLLPFVGEE78 pKa = 4.26EE79 pKa = 3.86QQ80 pKa = 3.46
Molecular weight: 9.32 kDa
Isoelectric point according different methods:
Peptides (in silico digests for buttom-up proteomics)
Below you can find in silico digests of the whole proteome with Trypsin, Chymotrypsin, Trypsin+LysC, LysN, ArgC proteases suitable for different mass spec machines.| Try ESI |
 |
|---|
| ChTry ESI |
 |
|---|
| ArgC ESI |
 |
|---|
| LysN ESI |
 |
|---|
| TryLysC ESI |
 |
|---|
| Try MALDI |
 |
|---|
| ChTry MALDI |
 |
|---|
| ArgC MALDI |
 |
|---|
| LysN MALDI |
 |
|---|
| TryLysC MALDI |
 |
|---|
| Try LTQ |
 |
|---|
| ChTry LTQ |
 |
|---|
| ArgC LTQ |
 |
|---|
| LysN LTQ |
 |
|---|
| TryLysC LTQ |
 |
|---|
| Try MSlow |
 |
|---|
| ChTry MSlow |
 |
|---|
| ArgC MSlow |
 |
|---|
| LysN MSlow |
 |
|---|
| TryLysC MSlow |
 |
|---|
| Try MShigh |
 |
|---|
| ChTry MShigh |
 |
|---|
| ArgC MShigh |
 |
|---|
| LysN MShigh |
 |
|---|
| TryLysC MShigh |
 |
|---|
General Statistics
Number of major isoforms |
Number of additional isoforms |
Number of all proteins |
Number of amino acids |
Min. Seq. Length |
Max. Seq. Length |
Avg. Seq. Length |
Avg. Mol. Weight |
|---|---|---|---|---|---|---|---|
0 |
899546 |
20 |
2415 |
314.6 |
35.13 |
Amino acid frequency
Ala |
Cys |
Asp |
Glu |
Phe |
Gly |
His |
Ile |
Lys |
Leu |
|---|---|---|---|---|---|---|---|---|---|
7.202 ± 0.05 | 0.565 ± 0.012 |
4.993 ± 0.035 | 7.33 ± 0.052 |
4.397 ± 0.036 | 6.766 ± 0.045 |
1.698 ± 0.02 | 7.555 ± 0.039 |
6.782 ± 0.04 | 10.495 ± 0.061 |
Met |
Asn |
Gln |
Pro |
Arg |
Ser |
Thr |
Val |
Trp |
Tyr |
|---|---|---|---|---|---|---|---|---|---|
2.567 ± 0.025 | 4.573 ± 0.031 |
3.51 ± 0.027 | 4.258 ± 0.036 |
3.479 ± 0.033 | 6.272 ± 0.041 |
6.14 ± 0.041 | 6.972 ± 0.036 |
0.858 ± 0.015 | 3.586 ± 0.027 |
Most of the basic statistics you can see at this page can be downloaded from this CSV file
Proteome-pI is available under Creative Commons Attribution-NoDerivs license, for more details see here
| Reference: Kozlowski LP. Proteome-pI 2.0: Proteome Isoelectric Point Database Update. Nucleic Acids Res. 2021, doi: 10.1093/nar/gkab944 | Contact: Lukasz P. Kozlowski |
