Erysipelothrix sp. HDW6B
Taxonomy: cellular organisms; Bacteria; Terrabacteria group; Firmicutes; Erysipelotrichia; Erysipelotrichales; Erysipelotrichaceae; Erysipelothrix; unclassified Erysipelothrix
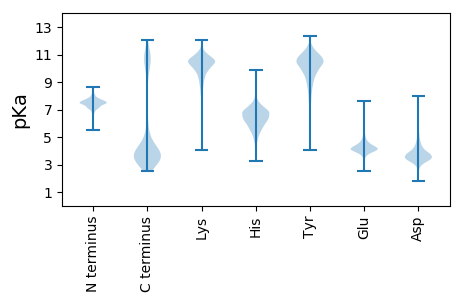
Average proteome isoelectric point is 5.98
Get precalculated fractions of proteins

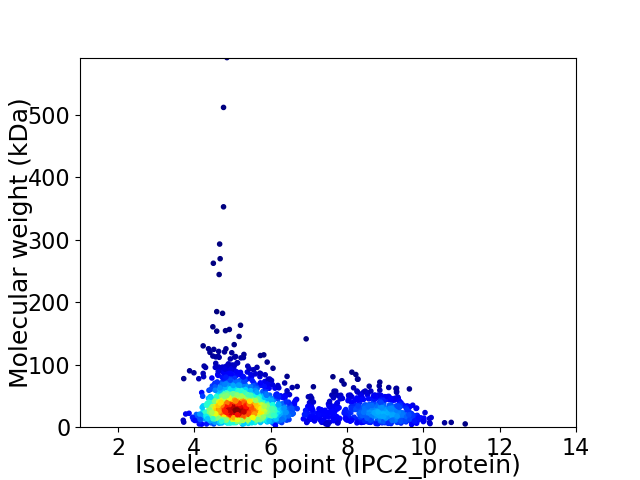
Virtual 2D-PAGE plot for 2061 proteins (isoelectric point calculated using IPC2_protein)
Get csv file with sequences according to given criteria:
* You can choose from 21 different methods for calculating isoelectric point
Summary statistics related to proteome-wise predictions


Protein with the lowest isoelectric point:
>tr|A0A6G7ZCT9|A0A6G7ZCT9_9FIRM Uncharacterized protein OS=Erysipelothrix sp. HDW6B OX=2714929 GN=G7061_09225 PE=4 SV=1
MM1 pKa = 7.45KK2 pKa = 10.35KK3 pKa = 10.5SIISVLLVTLLLFVSGCTQAGDD25 pKa = 4.05GYY27 pKa = 11.19KK28 pKa = 9.99VARR31 pKa = 11.84TMNTDD36 pKa = 3.0AYY38 pKa = 10.49SAIVVDD44 pKa = 4.77DD45 pKa = 4.31AKK47 pKa = 11.29QNVGILDD54 pKa = 3.84SQSVIDD60 pKa = 4.55AYY62 pKa = 10.21KK63 pKa = 10.07EE64 pKa = 3.9ASSNLDD70 pKa = 4.03DD71 pKa = 5.72IYY73 pKa = 11.13MEE75 pKa = 5.52LDD77 pKa = 3.34DD78 pKa = 5.56EE79 pKa = 4.72MIEE82 pKa = 4.14EE83 pKa = 4.35GLDD86 pKa = 3.43YY87 pKa = 11.24VFAAMGYY94 pKa = 8.65YY95 pKa = 9.86YY96 pKa = 9.63EE97 pKa = 4.4TVYY100 pKa = 10.97QLLIGDD106 pKa = 4.29SNFEE110 pKa = 3.85AVYY113 pKa = 10.8LGDD116 pKa = 5.26DD117 pKa = 3.93SNQNSIDD124 pKa = 3.35GVTVLKK130 pKa = 9.42FTEE133 pKa = 4.26APEE136 pKa = 4.13IEE138 pKa = 4.35VEE140 pKa = 4.77LIEE143 pKa = 4.9IMNDD147 pKa = 2.71IARR150 pKa = 11.84EE151 pKa = 4.07EE152 pKa = 4.06IGEE155 pKa = 4.07AVYY158 pKa = 10.91VQDD161 pKa = 3.13NFMVVVNAEE170 pKa = 4.25YY171 pKa = 10.63INDD174 pKa = 3.36VDD176 pKa = 5.44AFLALAKK183 pKa = 9.87TGVASVIKK191 pKa = 10.44KK192 pKa = 10.15
MM1 pKa = 7.45KK2 pKa = 10.35KK3 pKa = 10.5SIISVLLVTLLLFVSGCTQAGDD25 pKa = 4.05GYY27 pKa = 11.19KK28 pKa = 9.99VARR31 pKa = 11.84TMNTDD36 pKa = 3.0AYY38 pKa = 10.49SAIVVDD44 pKa = 4.77DD45 pKa = 4.31AKK47 pKa = 11.29QNVGILDD54 pKa = 3.84SQSVIDD60 pKa = 4.55AYY62 pKa = 10.21KK63 pKa = 10.07EE64 pKa = 3.9ASSNLDD70 pKa = 4.03DD71 pKa = 5.72IYY73 pKa = 11.13MEE75 pKa = 5.52LDD77 pKa = 3.34DD78 pKa = 5.56EE79 pKa = 4.72MIEE82 pKa = 4.14EE83 pKa = 4.35GLDD86 pKa = 3.43YY87 pKa = 11.24VFAAMGYY94 pKa = 8.65YY95 pKa = 9.86YY96 pKa = 9.63EE97 pKa = 4.4TVYY100 pKa = 10.97QLLIGDD106 pKa = 4.29SNFEE110 pKa = 3.85AVYY113 pKa = 10.8LGDD116 pKa = 5.26DD117 pKa = 3.93SNQNSIDD124 pKa = 3.35GVTVLKK130 pKa = 9.42FTEE133 pKa = 4.26APEE136 pKa = 4.13IEE138 pKa = 4.35VEE140 pKa = 4.77LIEE143 pKa = 4.9IMNDD147 pKa = 2.71IARR150 pKa = 11.84EE151 pKa = 4.07EE152 pKa = 4.06IGEE155 pKa = 4.07AVYY158 pKa = 10.91VQDD161 pKa = 3.13NFMVVVNAEE170 pKa = 4.25YY171 pKa = 10.63INDD174 pKa = 3.36VDD176 pKa = 5.44AFLALAKK183 pKa = 9.87TGVASVIKK191 pKa = 10.44KK192 pKa = 10.15
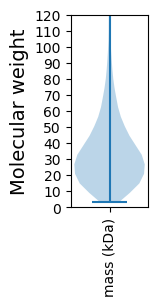
Molecular weight: 21.17 kDa
Isoelectric point according different methods:
Protein with the highest isoelectric point:
>tr|A0A6G7Z8E4|A0A6G7Z8E4_9FIRM Recombination protein RecR OS=Erysipelothrix sp. HDW6B OX=2714929 GN=recR PE=3 SV=1
MM1 pKa = 7.35KK2 pKa = 9.43RR3 pKa = 11.84TYY5 pKa = 10.14QPSKK9 pKa = 9.95RR10 pKa = 11.84KK11 pKa = 7.81HH12 pKa = 5.11QKK14 pKa = 8.48VHH16 pKa = 5.53GFRR19 pKa = 11.84ARR21 pKa = 11.84MKK23 pKa = 8.28TVGGRR28 pKa = 11.84RR29 pKa = 11.84VLSRR33 pKa = 11.84RR34 pKa = 11.84RR35 pKa = 11.84SKK37 pKa = 10.63GRR39 pKa = 11.84KK40 pKa = 8.44VLSAA44 pKa = 4.05
MM1 pKa = 7.35KK2 pKa = 9.43RR3 pKa = 11.84TYY5 pKa = 10.14QPSKK9 pKa = 9.95RR10 pKa = 11.84KK11 pKa = 7.81HH12 pKa = 5.11QKK14 pKa = 8.48VHH16 pKa = 5.53GFRR19 pKa = 11.84ARR21 pKa = 11.84MKK23 pKa = 8.28TVGGRR28 pKa = 11.84RR29 pKa = 11.84VLSRR33 pKa = 11.84RR34 pKa = 11.84RR35 pKa = 11.84SKK37 pKa = 10.63GRR39 pKa = 11.84KK40 pKa = 8.44VLSAA44 pKa = 4.05
Molecular weight: 5.22 kDa
Isoelectric point according different methods:
Peptides (in silico digests for buttom-up proteomics)
Below you can find in silico digests of the whole proteome with Trypsin, Chymotrypsin, Trypsin+LysC, LysN, ArgC proteases suitable for different mass spec machines.| Try ESI |
 |
|---|
| ChTry ESI |
 |
|---|
| ArgC ESI |
 |
|---|
| LysN ESI |
 |
|---|
| TryLysC ESI |
 |
|---|
| Try MALDI |
 |
|---|
| ChTry MALDI |
 |
|---|
| ArgC MALDI |
 |
|---|
| LysN MALDI |
 |
|---|
| TryLysC MALDI |
 |
|---|
| Try LTQ |
 |
|---|
| ChTry LTQ |
 |
|---|
| ArgC LTQ |
 |
|---|
| LysN LTQ |
 |
|---|
| TryLysC LTQ |
 |
|---|
| Try MSlow |
 |
|---|
| ChTry MSlow |
 |
|---|
| ArgC MSlow |
 |
|---|
| LysN MSlow |
 |
|---|
| TryLysC MSlow |
 |
|---|
| Try MShigh |
 |
|---|
| ChTry MShigh |
 |
|---|
| ArgC MShigh |
 |
|---|
| LysN MShigh |
 |
|---|
| TryLysC MShigh |
 |
|---|
General Statistics
Number of major isoforms |
Number of additional isoforms |
Number of all proteins |
Number of amino acids |
Min. Seq. Length |
Max. Seq. Length |
Avg. Seq. Length |
Avg. Mol. Weight |
|---|---|---|---|---|---|---|---|
0 |
663539 |
25 |
5519 |
322.0 |
36.12 |
Amino acid frequency
Ala |
Cys |
Asp |
Glu |
Phe |
Gly |
His |
Ile |
Lys |
Leu |
|---|---|---|---|---|---|---|---|---|---|
6.923 ± 0.058 | 0.53 ± 0.016 |
5.991 ± 0.051 | 6.463 ± 0.054 |
4.496 ± 0.048 | 6.365 ± 0.063 |
2.098 ± 0.034 | 8.216 ± 0.057 |
5.939 ± 0.052 | 9.068 ± 0.068 |
Met |
Asn |
Gln |
Pro |
Arg |
Ser |
Thr |
Val |
Trp |
Tyr |
|---|---|---|---|---|---|---|---|---|---|
2.934 ± 0.036 | 5.071 ± 0.043 |
3.292 ± 0.032 | 3.615 ± 0.032 |
3.972 ± 0.045 | 6.299 ± 0.042 |
6.331 ± 0.078 | 7.529 ± 0.053 |
0.802 ± 0.018 | 4.065 ± 0.043 |
Most of the basic statistics you can see at this page can be downloaded from this CSV file
Proteome-pI is available under Creative Commons Attribution-NoDerivs license, for more details see here
| Reference: Kozlowski LP. Proteome-pI 2.0: Proteome Isoelectric Point Database Update. Nucleic Acids Res. 2021, doi: 10.1093/nar/gkab944 | Contact: Lukasz P. Kozlowski |
