Acetonema longum DSM 6540
Taxonomy: cellular organisms; Bacteria; Terrabacteria group; Firmicutes; Negativicutes; Selenomonadales; Sporomusaceae; Acetonema; Acetonema longum
Average proteome isoelectric point is 6.64
Get precalculated fractions of proteins

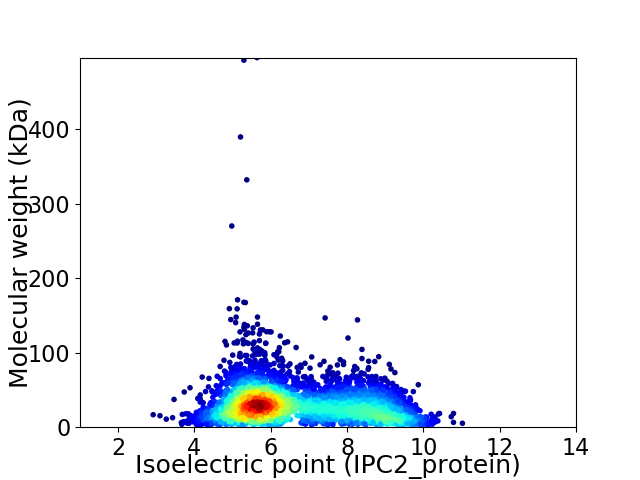
Virtual 2D-PAGE plot for 4283 proteins (isoelectric point calculated using IPC2_protein)
Get csv file with sequences according to given criteria:
* You can choose from 21 different methods for calculating isoelectric point
Summary statistics related to proteome-wise predictions


Protein with the lowest isoelectric point:
>tr|F7NIE2|F7NIE2_9FIRM Uncharacterized protein OS=Acetonema longum DSM 6540 OX=1009370 GN=ALO_09224 PE=4 SV=1
MM1 pKa = 7.46GNVKK5 pKa = 10.29EE6 pKa = 4.3KK7 pKa = 10.7VAYY10 pKa = 10.01LQGLTKK16 pKa = 10.4GLNVSGEE23 pKa = 4.13SSEE26 pKa = 5.03GKK28 pKa = 9.95ILLNMIDD35 pKa = 3.75VLEE38 pKa = 4.42SLAQEE43 pKa = 3.97IHH45 pKa = 6.46LLSHH49 pKa = 7.07DD50 pKa = 3.78HH51 pKa = 7.16QEE53 pKa = 4.02LQDD56 pKa = 3.76YY57 pKa = 10.99VEE59 pKa = 5.11TIDD62 pKa = 5.3EE63 pKa = 4.57DD64 pKa = 3.87LHH66 pKa = 8.45DD67 pKa = 4.78LEE69 pKa = 4.45EE70 pKa = 4.31TVYY73 pKa = 10.77EE74 pKa = 4.69DD75 pKa = 4.09EE76 pKa = 5.06PADD79 pKa = 3.8EE80 pKa = 5.43PIVEE84 pKa = 4.39VEE86 pKa = 4.44CPRR89 pKa = 11.84CHH91 pKa = 5.55EE92 pKa = 4.38TVTFGADD99 pKa = 3.05NLEE102 pKa = 4.48DD103 pKa = 3.86EE104 pKa = 4.89DD105 pKa = 5.01VIEE108 pKa = 4.6ITCPTCGEE116 pKa = 4.06VVYY119 pKa = 10.65EE120 pKa = 4.02NTYY123 pKa = 9.34DD124 pKa = 3.55TDD126 pKa = 4.56ADD128 pKa = 3.78DD129 pKa = 5.71LIAVEE134 pKa = 4.56SKK136 pKa = 10.26PRR138 pKa = 11.84NINAGII144 pKa = 3.65
MM1 pKa = 7.46GNVKK5 pKa = 10.29EE6 pKa = 4.3KK7 pKa = 10.7VAYY10 pKa = 10.01LQGLTKK16 pKa = 10.4GLNVSGEE23 pKa = 4.13SSEE26 pKa = 5.03GKK28 pKa = 9.95ILLNMIDD35 pKa = 3.75VLEE38 pKa = 4.42SLAQEE43 pKa = 3.97IHH45 pKa = 6.46LLSHH49 pKa = 7.07DD50 pKa = 3.78HH51 pKa = 7.16QEE53 pKa = 4.02LQDD56 pKa = 3.76YY57 pKa = 10.99VEE59 pKa = 5.11TIDD62 pKa = 5.3EE63 pKa = 4.57DD64 pKa = 3.87LHH66 pKa = 8.45DD67 pKa = 4.78LEE69 pKa = 4.45EE70 pKa = 4.31TVYY73 pKa = 10.77EE74 pKa = 4.69DD75 pKa = 4.09EE76 pKa = 5.06PADD79 pKa = 3.8EE80 pKa = 5.43PIVEE84 pKa = 4.39VEE86 pKa = 4.44CPRR89 pKa = 11.84CHH91 pKa = 5.55EE92 pKa = 4.38TVTFGADD99 pKa = 3.05NLEE102 pKa = 4.48DD103 pKa = 3.86EE104 pKa = 4.89DD105 pKa = 5.01VIEE108 pKa = 4.6ITCPTCGEE116 pKa = 4.06VVYY119 pKa = 10.65EE120 pKa = 4.02NTYY123 pKa = 9.34DD124 pKa = 3.55TDD126 pKa = 4.56ADD128 pKa = 3.78DD129 pKa = 5.71LIAVEE134 pKa = 4.56SKK136 pKa = 10.26PRR138 pKa = 11.84NINAGII144 pKa = 3.65
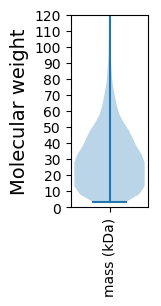
Molecular weight: 16.05 kDa
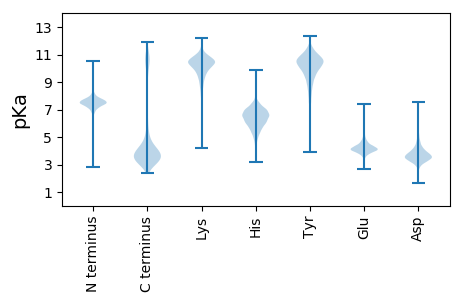
Isoelectric point according different methods:
Protein with the highest isoelectric point:
>tr|F7NQ96|F7NQ96_9FIRM Type II and III secretion system protein OS=Acetonema longum DSM 6540 OX=1009370 GN=ALO_21484 PE=3 SV=1
KKK2 pKa = 10.19KK3 pKa = 10.2VRR5 pKa = 11.84TRR7 pKa = 11.84ASVIVSRR14 pKa = 11.84GKKK17 pKa = 10.82MSGAAGRR24 pKa = 11.84AEEE27 pKa = 4.16RR28 pKa = 11.84QAAAWLGPRR37 pKa = 11.84GLMRR41 pKa = 11.84SRR43 pKa = 11.84AWGVLRR49 pKa = 11.84LSATPSPWQPVS
KKK2 pKa = 10.19KK3 pKa = 10.2VRR5 pKa = 11.84TRR7 pKa = 11.84ASVIVSRR14 pKa = 11.84GKKK17 pKa = 10.82MSGAAGRR24 pKa = 11.84AEEE27 pKa = 4.16RR28 pKa = 11.84QAAAWLGPRR37 pKa = 11.84GLMRR41 pKa = 11.84SRR43 pKa = 11.84AWGVLRR49 pKa = 11.84LSATPSPWQPVS
Molecular weight: 6.46 kDa
Isoelectric point according different methods:
Peptides (in silico digests for buttom-up proteomics)
Below you can find in silico digests of the whole proteome with Trypsin, Chymotrypsin, Trypsin+LysC, LysN, ArgC proteases suitable for different mass spec machines.| Try ESI |
 |
|---|
| ChTry ESI |
 |
|---|
| ArgC ESI |
 |
|---|
| LysN ESI |
 |
|---|
| TryLysC ESI |
 |
|---|
| Try MALDI |
 |
|---|
| ChTry MALDI |
 |
|---|
| ArgC MALDI |
 |
|---|
| LysN MALDI |
 |
|---|
| TryLysC MALDI |
 |
|---|
| Try LTQ |
 |
|---|
| ChTry LTQ |
 |
|---|
| ArgC LTQ |
 |
|---|
| LysN LTQ |
 |
|---|
| TryLysC LTQ |
 |
|---|
| Try MSlow |
 |
|---|
| ChTry MSlow |
 |
|---|
| ArgC MSlow |
 |
|---|
| LysN MSlow |
 |
|---|
| TryLysC MSlow |
 |
|---|
| Try MShigh |
 |
|---|
| ChTry MShigh |
 |
|---|
| ArgC MShigh |
 |
|---|
| LysN MShigh |
 |
|---|
| TryLysC MShigh |
 |
|---|
General Statistics
Number of major isoforms |
Number of additional isoforms |
Number of all proteins |
Number of amino acids |
Min. Seq. Length |
Max. Seq. Length |
Avg. Seq. Length |
Avg. Mol. Weight |
|---|---|---|---|---|---|---|---|
0 |
1245218 |
30 |
4427 |
290.7 |
32.06 |
Amino acid frequency
Ala |
Cys |
Asp |
Glu |
Phe |
Gly |
His |
Ile |
Lys |
Leu |
|---|---|---|---|---|---|---|---|---|---|
9.66 ± 0.045 | 1.167 ± 0.017 |
4.96 ± 0.028 | 6.047 ± 0.038 |
3.804 ± 0.025 | 7.776 ± 0.037 |
1.918 ± 0.018 | 6.965 ± 0.032 |
5.235 ± 0.032 | 10.059 ± 0.047 |
Met |
Asn |
Gln |
Pro |
Arg |
Ser |
Thr |
Val |
Trp |
Tyr |
|---|---|---|---|---|---|---|---|---|---|
2.769 ± 0.021 | 3.616 ± 0.029 |
4.163 ± 0.027 | 4.146 ± 0.029 |
5.283 ± 0.034 | 5.571 ± 0.028 |
5.319 ± 0.031 | 7.31 ± 0.038 |
1.045 ± 0.017 | 3.185 ± 0.025 |
Most of the basic statistics you can see at this page can be downloaded from this CSV file
Proteome-pI is available under Creative Commons Attribution-NoDerivs license, for more details see here
| Reference: Kozlowski LP. Proteome-pI 2.0: Proteome Isoelectric Point Database Update. Nucleic Acids Res. 2021, doi: 10.1093/nar/gkab944 | Contact: Lukasz P. Kozlowski |
