Bat SARS-like coronavirus WIV1
Taxonomy: Viruses; Riboviria; Orthornavirae; Pisuviricota; Pisoniviricetes; Nidovirales; Cornidovirineae; Coronaviridae; Orthocoronavirinae; Betacoronavirus; Sarbecovirus; Severe acute respiratory syndrome-related coronavirus
Average proteome isoelectric point is 6.5
Get precalculated fractions of proteins
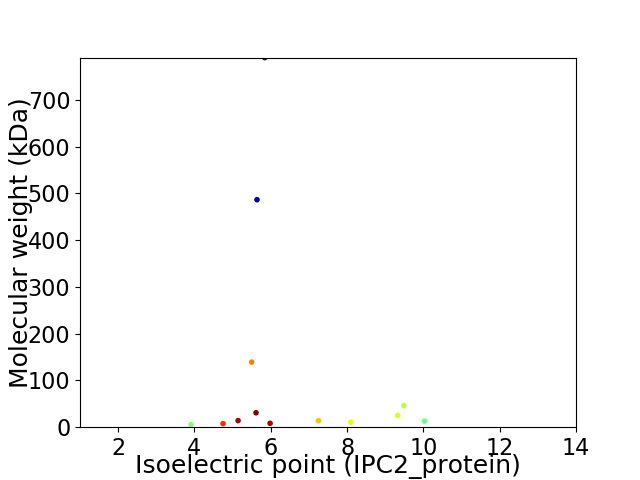
Virtual 2D-PAGE plot for 13 proteins (isoelectric point calculated using IPC2_protein)
Get csv file with sequences according to given criteria:
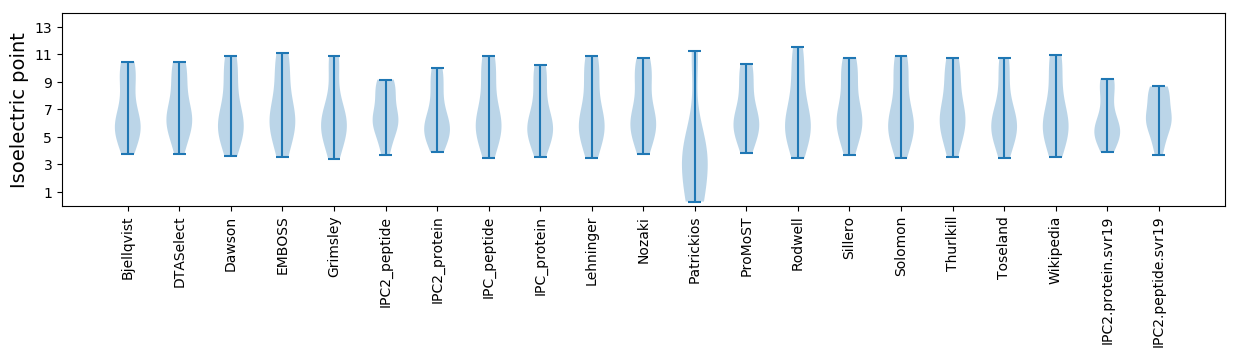
* You can choose from 21 different methods for calculating isoelectric point
Summary statistics related to proteome-wise predictions
Protein with the lowest isoelectric point:
>tr|U5WIP3|U5WIP3_SARS Uncharacterized protein OS=Bat SARS-like coronavirus WIV1 OX=1415852 PE=4 SV=1
MM1 pKa = 7.71NEE3 pKa = 3.36LTLIDD8 pKa = 5.36FYY10 pKa = 11.69LCFLAFLLFLVLIMLIIFWFSLEE33 pKa = 4.06LQDD36 pKa = 5.95IEE38 pKa = 4.55EE39 pKa = 4.77PCNKK43 pKa = 9.46VV44 pKa = 2.79
MM1 pKa = 7.71NEE3 pKa = 3.36LTLIDD8 pKa = 5.36FYY10 pKa = 11.69LCFLAFLLFLVLIMLIIFWFSLEE33 pKa = 4.06LQDD36 pKa = 5.95IEE38 pKa = 4.55EE39 pKa = 4.77PCNKK43 pKa = 9.46VV44 pKa = 2.79
Molecular weight: 5.32 kDa
Isoelectric point according different methods:
Protein with the highest isoelectric point:
>tr|U5WI16|U5WI16_SARS Accessory protein 7a OS=Bat SARS-like coronavirus WIV1 OX=1415852 PE=4 SV=1
MM1 pKa = 7.29MPTTLFAGTHH11 pKa = 4.14ITMTTVYY18 pKa = 9.9RR19 pKa = 11.84ITVSQIQLSLLQVTAFQHH37 pKa = 5.26QNSKK41 pKa = 8.78KK42 pKa = 5.45TTKK45 pKa = 10.43LVVILRR51 pKa = 11.84IGTQVLKK58 pKa = 10.45TMSLYY63 pKa = 10.0MAISPKK69 pKa = 9.51FTTSLSLHH77 pKa = 6.65KK78 pKa = 10.58LLQTLVLKK86 pKa = 9.49MLHH89 pKa = 6.16SSSLTSLLKK98 pKa = 7.42THH100 pKa = 7.03RR101 pKa = 11.84MCKK104 pKa = 8.43YY105 pKa = 7.15TQSTALQEE113 pKa = 4.15LL114 pKa = 4.15
MM1 pKa = 7.29MPTTLFAGTHH11 pKa = 4.14ITMTTVYY18 pKa = 9.9RR19 pKa = 11.84ITVSQIQLSLLQVTAFQHH37 pKa = 5.26QNSKK41 pKa = 8.78KK42 pKa = 5.45TTKK45 pKa = 10.43LVVILRR51 pKa = 11.84IGTQVLKK58 pKa = 10.45TMSLYY63 pKa = 10.0MAISPKK69 pKa = 9.51FTTSLSLHH77 pKa = 6.65KK78 pKa = 10.58LLQTLVLKK86 pKa = 9.49MLHH89 pKa = 6.16SSSLTSLLKK98 pKa = 7.42THH100 pKa = 7.03RR101 pKa = 11.84MCKK104 pKa = 8.43YY105 pKa = 7.15TQSTALQEE113 pKa = 4.15LL114 pKa = 4.15
Molecular weight: 12.87 kDa
Isoelectric point according different methods:
Peptides (in silico digests for buttom-up proteomics)
Below you can find in silico digests of the whole proteome with Trypsin, Chymotrypsin, Trypsin+LysC, LysN, ArgC proteases suitable for different mass spec machines.| Try ESI |
 |
|---|
| ChTry ESI |
|
|---|
| ArgC ESI |
|
|---|
| LysN ESI |
|
|---|
| TryLysC ESI |
|
|---|
| Try MALDI |
|
|---|
| ChTry MALDI |
|
|---|
| ArgC MALDI |
|
|---|
| LysN MALDI |
|
|---|
| TryLysC MALDI |
|
|---|
| Try LTQ |
|
|---|
| ChTry LTQ |
|
|---|
| ArgC LTQ |
|
|---|
| LysN LTQ |
|
|---|
| TryLysC LTQ |
|
|---|
| Try MSlow |
|
|---|
| ChTry MSlow |
|
|---|
| ArgC MSlow |
|
|---|
| LysN MSlow |
|
|---|
| TryLysC MSlow |
|
|---|
| Try MShigh |
|
|---|
| ChTry MShigh |
|
|---|
| ArgC MShigh |
|
|---|
| LysN MShigh |
|
|---|
| TryLysC MShigh |
|
|---|
General Statistics
Number of major isoforms |
Number of additional isoforms |
Number of all proteins |
Number of amino acids |
Min. Seq. Length |
Max. Seq. Length |
Avg. Seq. Length |
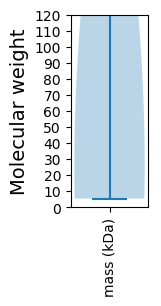
Avg. Mol. Weight |
|---|---|---|---|---|---|---|---|
0 |
14265 |
44 |
7073 |
1097.3 |
122.37 |
Amino acid frequency
Ala |
Cys |
Asp |
Glu |
Phe |
Gly |
His |
Ile |
Lys |
Leu |
|---|---|---|---|---|---|---|---|---|---|
7.115 ± 0.365 | 3.134 ± 0.415 |
5.216 ± 0.452 | 4.816 ± 0.445 |
4.809 ± 0.46 | 6.064 ± 0.52 |
2.061 ± 0.218 | 5.033 ± 0.57 |
5.622 ± 0.441 | 9.828 ± 0.743 |
Met |
Asn |
Gln |
Pro |
Arg |
Ser |
Thr |
Val |
Trp |
Tyr |
|---|---|---|---|---|---|---|---|---|---|
2.419 ± 0.214 | 5.124 ± 0.347 |
4.059 ± 0.493 | 3.575 ± 0.597 |
3.694 ± 0.524 | 6.737 ± 0.292 |
7.242 ± 0.253 | 7.964 ± 0.757 |
1.087 ± 0.127 | 4.402 ± 0.267 |
Most of the basic statistics you can see at this page can be downloaded from this CSV file
See this proteome in:

Proteome-pI is available under Creative Commons Attribution-NoDerivs license, for more details see here
| Reference: Kozlowski LP. Proteome-pI 2.0: Proteome Isoelectric Point Database Update. Nucleic Acids Res. 2021, doi: 10.1093/nar/gkab944 | Contact: Lukasz P. Kozlowski |