Mycobacterium phage ArcusAngelus
Taxonomy: Viruses; Duplodnaviria; Heunggongvirae; Uroviricota; Caudoviricetes; Caudovirales; Siphoviridae; Cheoctovirus; unclassified Cheoctovirus
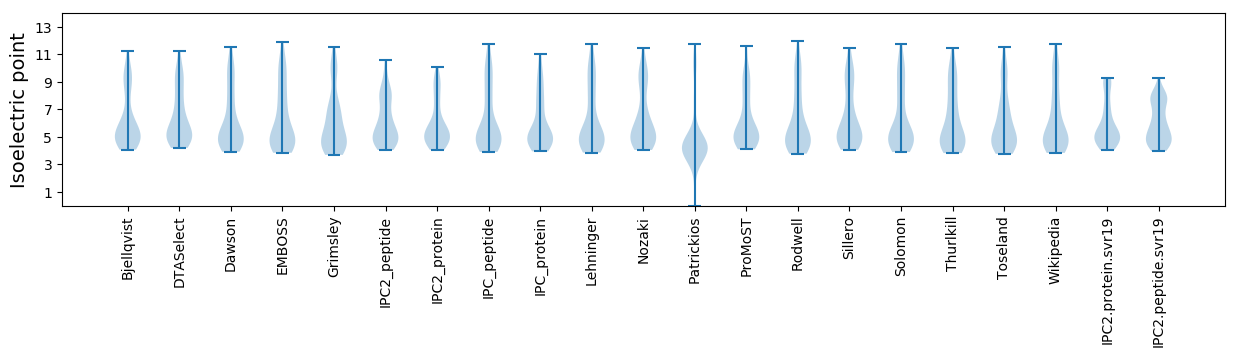
Average proteome isoelectric point is 5.99
Get precalculated fractions of proteins

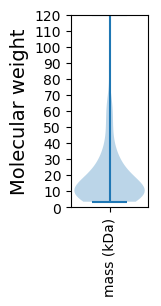
Virtual 2D-PAGE plot for 103 proteins (isoelectric point calculated using IPC2_protein)
Get csv file with sequences according to given criteria:
* You can choose from 21 different methods for calculating isoelectric point
Summary statistics related to proteome-wise predictions

Protein with the lowest isoelectric point:
>tr|A0A386KQE0|A0A386KQE0_9CAUD Uncharacterized protein OS=Mycobacterium phage ArcusAngelus OX=2315613 GN=90 PE=4 SV=1
MM1 pKa = 7.44TCLLCDD7 pKa = 3.87HH8 pKa = 7.18PRR10 pKa = 11.84SSHH13 pKa = 6.49APQCRR18 pKa = 11.84VRR20 pKa = 11.84MGVDD24 pKa = 3.13RR25 pKa = 11.84DD26 pKa = 3.78DD27 pKa = 3.68MNTYY31 pKa = 8.02TICLCPGFEE40 pKa = 4.08GTEE43 pKa = 4.07DD44 pKa = 3.76EE45 pKa = 5.48EE46 pKa = 4.89EE47 pKa = 4.23DD48 pKa = 3.61TT49 pKa = 5.47
MM1 pKa = 7.44TCLLCDD7 pKa = 3.87HH8 pKa = 7.18PRR10 pKa = 11.84SSHH13 pKa = 6.49APQCRR18 pKa = 11.84VRR20 pKa = 11.84MGVDD24 pKa = 3.13RR25 pKa = 11.84DD26 pKa = 3.78DD27 pKa = 3.68MNTYY31 pKa = 8.02TICLCPGFEE40 pKa = 4.08GTEE43 pKa = 4.07DD44 pKa = 3.76EE45 pKa = 5.48EE46 pKa = 4.89EE47 pKa = 4.23DD48 pKa = 3.61TT49 pKa = 5.47
Molecular weight: 5.58 kDa
Isoelectric point according different methods:
Protein with the highest isoelectric point:
>tr|A0A386KQP9|A0A386KQP9_9CAUD Uncharacterized protein OS=Mycobacterium phage ArcusAngelus OX=2315613 GN=37 PE=4 SV=1
MM1 pKa = 7.7KK2 pKa = 10.18IHH4 pKa = 5.44VQSRR8 pKa = 11.84GPAGWNATVLFTAGTVYY25 pKa = 10.04TVSDD29 pKa = 3.63DD30 pKa = 3.35QGRR33 pKa = 11.84KK34 pKa = 9.22HH35 pKa = 6.79LIDD38 pKa = 3.4TSRR41 pKa = 11.84VTVRR45 pKa = 11.84RR46 pKa = 11.84LSS48 pKa = 3.31
MM1 pKa = 7.7KK2 pKa = 10.18IHH4 pKa = 5.44VQSRR8 pKa = 11.84GPAGWNATVLFTAGTVYY25 pKa = 10.04TVSDD29 pKa = 3.63DD30 pKa = 3.35QGRR33 pKa = 11.84KK34 pKa = 9.22HH35 pKa = 6.79LIDD38 pKa = 3.4TSRR41 pKa = 11.84VTVRR45 pKa = 11.84RR46 pKa = 11.84LSS48 pKa = 3.31
Molecular weight: 5.33 kDa
Isoelectric point according different methods:
Peptides (in silico digests for buttom-up proteomics)
Below you can find in silico digests of the whole proteome with Trypsin, Chymotrypsin, Trypsin+LysC, LysN, ArgC proteases suitable for different mass spec machines.| Try ESI |
 |
|---|
| ChTry ESI |
|
|---|
| ArgC ESI |
|
|---|
| LysN ESI |
|
|---|
| TryLysC ESI |
|
|---|
| Try MALDI |
|
|---|
| ChTry MALDI |
|
|---|
| ArgC MALDI |
|
|---|
| LysN MALDI |
|
|---|
| TryLysC MALDI |
|
|---|
| Try LTQ |
|
|---|
| ChTry LTQ |
|
|---|
| ArgC LTQ |
|
|---|
| LysN LTQ |
|
|---|
| TryLysC LTQ |
|
|---|
| Try MSlow |
|
|---|
| ChTry MSlow |
|
|---|
| ArgC MSlow |
|
|---|
| LysN MSlow |
|
|---|
| TryLysC MSlow |
|
|---|
| Try MShigh |
|
|---|
| ChTry MShigh |
|
|---|
| ArgC MShigh |
|
|---|
| LysN MShigh |
|
|---|
| TryLysC MShigh |
|
|---|
General Statistics
Number of major isoforms |
Number of additional isoforms |
Number of all proteins |
Number of amino acids |
Min. Seq. Length |
Max. Seq. Length |
Avg. Seq. Length |
Avg. Mol. Weight |
|---|---|---|---|---|---|---|---|
0 |
18441 |
30 |
1182 |
179.0 |
19.62 |
Amino acid frequency
Ala |
Cys |
Asp |
Glu |
Phe |
Gly |
His |
Ile |
Lys |
Leu |
|---|---|---|---|---|---|---|---|---|---|
10.694 ± 0.436 | 1.231 ± 0.158 |
6.719 ± 0.234 | 5.894 ± 0.296 |
2.928 ± 0.179 | 8.573 ± 0.565 |
2.153 ± 0.196 | 4.344 ± 0.189 |
3.205 ± 0.202 | 7.277 ± 0.217 |
Met |
Asn |
Gln |
Pro |
Arg |
Ser |
Thr |
Val |
Trp |
Tyr |
|---|---|---|---|---|---|---|---|---|---|
2.24 ± 0.106 | 3.411 ± 0.142 |
6.035 ± 0.203 | 3.433 ± 0.199 |
7.028 ± 0.407 | 5.857 ± 0.283 |
6.659 ± 0.262 | 7.386 ± 0.266 |
2.451 ± 0.161 | 2.484 ± 0.159 |
Most of the basic statistics you can see at this page can be downloaded from this CSV file
See this proteome in:

Proteome-pI is available under Creative Commons Attribution-NoDerivs license, for more details see here
| Reference: Kozlowski LP. Proteome-pI 2.0: Proteome Isoelectric Point Database Update. Nucleic Acids Res. 2021, doi: 10.1093/nar/gkab944 | Contact: Lukasz P. Kozlowski |