Alcanivorax sp. N3-2A
Taxonomy: cellular organisms; Bacteria; Proteobacteria; Gammaproteobacteria; Oceanospirillales; Alcanivoracaceae; Alcanivorax; unclassified Alcanivorax
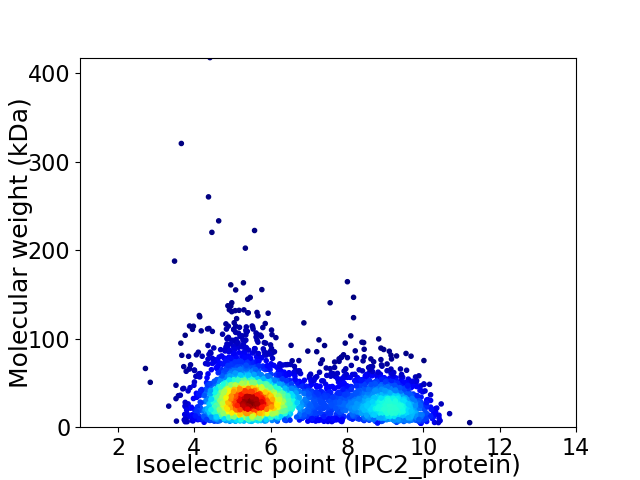
Average proteome isoelectric point is 6.48
Get precalculated fractions of proteins

Virtual 2D-PAGE plot for 3757 proteins (isoelectric point calculated using IPC2_protein)
Get csv file with sequences according to given criteria:
* You can choose from 21 different methods for calculating isoelectric point
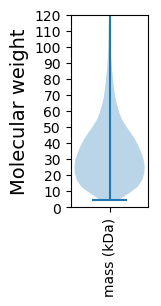
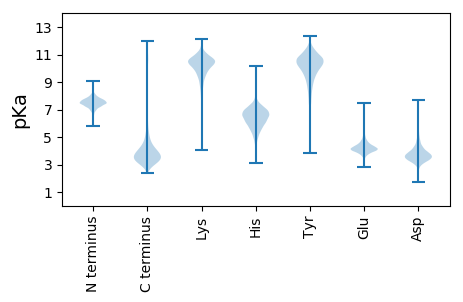
Summary statistics related to proteome-wise predictions


Protein with the lowest isoelectric point:
>tr|A0A220SME0|A0A220SME0_9GAMM DctA-YdbH domain-containing protein OS=Alcanivorax sp. N3-2A OX=2014542 GN=CEK62_09465 PE=4 SV=1
MM1 pKa = 7.63LGLAPLAGCDD11 pKa = 4.22NDD13 pKa = 5.21TSDD16 pKa = 4.98HH17 pKa = 7.39DD18 pKa = 4.26NDD20 pKa = 3.8ASNGGGDD27 pKa = 3.36NGGNDD32 pKa = 3.45GGGNDD37 pKa = 5.08GGGNDD42 pKa = 5.54DD43 pKa = 4.98GGSDD47 pKa = 4.63DD48 pKa = 5.41GGDD51 pKa = 3.51NGGDD55 pKa = 3.44NDD57 pKa = 4.35NPPTPTLVITSDD69 pKa = 3.01NATAVLIQSRR79 pKa = 11.84MALDD83 pKa = 3.96LLPRR87 pKa = 11.84LLVGANVFYY96 pKa = 10.84SNSIAVQGYY105 pKa = 10.78DD106 pKa = 5.23DD107 pKa = 6.66FPPCDD112 pKa = 3.45NAEE115 pKa = 4.13GQVQLLGDD123 pKa = 3.84NPGQPTTLIASDD135 pKa = 4.95CDD137 pKa = 3.65DD138 pKa = 3.83LSYY141 pKa = 11.03PRR143 pKa = 11.84NFNGRR148 pKa = 11.84LDD150 pKa = 4.63LDD152 pKa = 4.26FSNADD157 pKa = 3.83DD158 pKa = 4.52PLSTFTGFAEE168 pKa = 5.48RR169 pKa = 11.84IQAYY173 pKa = 9.98DD174 pKa = 3.33PNLRR178 pKa = 11.84LSANGGLRR186 pKa = 11.84LHH188 pKa = 7.09PEE190 pKa = 4.19DD191 pKa = 4.86PDD193 pKa = 4.26DD194 pKa = 4.12YY195 pKa = 11.4FGIAVAHH202 pKa = 5.93QADD205 pKa = 3.37IDD207 pKa = 3.82ITLEE211 pKa = 4.0LLPGGSDD218 pKa = 3.53TPITSLGFDD227 pKa = 3.25FHH229 pKa = 7.75DD230 pKa = 3.71YY231 pKa = 9.16TSRR234 pKa = 11.84YY235 pKa = 8.97SSSIHH240 pKa = 6.34FDD242 pKa = 3.4DD243 pKa = 4.93VPFPLLSGAGDD254 pKa = 3.38VTFRR258 pKa = 11.84GLAEE262 pKa = 4.08GRR264 pKa = 11.84VTLTTPRR271 pKa = 11.84QLTDD275 pKa = 3.72PDD277 pKa = 3.77ASNPLCYY284 pKa = 10.07GDD286 pKa = 4.67GVIEE290 pKa = 4.12VEE292 pKa = 4.23GAEE295 pKa = 4.33GSSVRR300 pKa = 11.84LDD302 pKa = 3.54YY303 pKa = 11.59NGAQAILSVNGALLASGDD321 pKa = 4.27CTDD324 pKa = 5.41LTQQWTSQVAASLPPYY340 pKa = 10.13RR341 pKa = 5.66
MM1 pKa = 7.63LGLAPLAGCDD11 pKa = 4.22NDD13 pKa = 5.21TSDD16 pKa = 4.98HH17 pKa = 7.39DD18 pKa = 4.26NDD20 pKa = 3.8ASNGGGDD27 pKa = 3.36NGGNDD32 pKa = 3.45GGGNDD37 pKa = 5.08GGGNDD42 pKa = 5.54DD43 pKa = 4.98GGSDD47 pKa = 4.63DD48 pKa = 5.41GGDD51 pKa = 3.51NGGDD55 pKa = 3.44NDD57 pKa = 4.35NPPTPTLVITSDD69 pKa = 3.01NATAVLIQSRR79 pKa = 11.84MALDD83 pKa = 3.96LLPRR87 pKa = 11.84LLVGANVFYY96 pKa = 10.84SNSIAVQGYY105 pKa = 10.78DD106 pKa = 5.23DD107 pKa = 6.66FPPCDD112 pKa = 3.45NAEE115 pKa = 4.13GQVQLLGDD123 pKa = 3.84NPGQPTTLIASDD135 pKa = 4.95CDD137 pKa = 3.65DD138 pKa = 3.83LSYY141 pKa = 11.03PRR143 pKa = 11.84NFNGRR148 pKa = 11.84LDD150 pKa = 4.63LDD152 pKa = 4.26FSNADD157 pKa = 3.83DD158 pKa = 4.52PLSTFTGFAEE168 pKa = 5.48RR169 pKa = 11.84IQAYY173 pKa = 9.98DD174 pKa = 3.33PNLRR178 pKa = 11.84LSANGGLRR186 pKa = 11.84LHH188 pKa = 7.09PEE190 pKa = 4.19DD191 pKa = 4.86PDD193 pKa = 4.26DD194 pKa = 4.12YY195 pKa = 11.4FGIAVAHH202 pKa = 5.93QADD205 pKa = 3.37IDD207 pKa = 3.82ITLEE211 pKa = 4.0LLPGGSDD218 pKa = 3.53TPITSLGFDD227 pKa = 3.25FHH229 pKa = 7.75DD230 pKa = 3.71YY231 pKa = 9.16TSRR234 pKa = 11.84YY235 pKa = 8.97SSSIHH240 pKa = 6.34FDD242 pKa = 3.4DD243 pKa = 4.93VPFPLLSGAGDD254 pKa = 3.38VTFRR258 pKa = 11.84GLAEE262 pKa = 4.08GRR264 pKa = 11.84VTLTTPRR271 pKa = 11.84QLTDD275 pKa = 3.72PDD277 pKa = 3.77ASNPLCYY284 pKa = 10.07GDD286 pKa = 4.67GVIEE290 pKa = 4.12VEE292 pKa = 4.23GAEE295 pKa = 4.33GSSVRR300 pKa = 11.84LDD302 pKa = 3.54YY303 pKa = 11.59NGAQAILSVNGALLASGDD321 pKa = 4.27CTDD324 pKa = 5.41LTQQWTSQVAASLPPYY340 pKa = 10.13RR341 pKa = 5.66
Molecular weight: 35.61 kDa
Isoelectric point according different methods:
Protein with the highest isoelectric point:
>tr|A0A220SR68|A0A220SR68_9GAMM CoA transferase OS=Alcanivorax sp. N3-2A OX=2014542 GN=CEK62_16935 PE=4 SV=1
MM1 pKa = 7.45KK2 pKa = 9.61RR3 pKa = 11.84TFQPSNLKK11 pKa = 10.16RR12 pKa = 11.84KK13 pKa = 9.08RR14 pKa = 11.84NHH16 pKa = 5.37GFRR19 pKa = 11.84ARR21 pKa = 11.84MATKK25 pKa = 10.2SGRR28 pKa = 11.84KK29 pKa = 8.76ILAARR34 pKa = 11.84RR35 pKa = 11.84AKK37 pKa = 9.93GRR39 pKa = 11.84KK40 pKa = 8.91RR41 pKa = 11.84LSAA44 pKa = 3.96
MM1 pKa = 7.45KK2 pKa = 9.61RR3 pKa = 11.84TFQPSNLKK11 pKa = 10.16RR12 pKa = 11.84KK13 pKa = 9.08RR14 pKa = 11.84NHH16 pKa = 5.37GFRR19 pKa = 11.84ARR21 pKa = 11.84MATKK25 pKa = 10.2SGRR28 pKa = 11.84KK29 pKa = 8.76ILAARR34 pKa = 11.84RR35 pKa = 11.84AKK37 pKa = 9.93GRR39 pKa = 11.84KK40 pKa = 8.91RR41 pKa = 11.84LSAA44 pKa = 3.96
Molecular weight: 5.14 kDa
Isoelectric point according different methods:
Peptides (in silico digests for buttom-up proteomics)
Below you can find in silico digests of the whole proteome with Trypsin, Chymotrypsin, Trypsin+LysC, LysN, ArgC proteases suitable for different mass spec machines.| Try ESI |
 |
|---|
| ChTry ESI |
 |
|---|
| ArgC ESI |
 |
|---|
| LysN ESI |
 |
|---|
| TryLysC ESI |
 |
|---|
| Try MALDI |
 |
|---|
| ChTry MALDI |
 |
|---|
| ArgC MALDI |
 |
|---|
| LysN MALDI |
 |
|---|
| TryLysC MALDI |
 |
|---|
| Try LTQ |
 |
|---|
| ChTry LTQ |
 |
|---|
| ArgC LTQ |
 |
|---|
| LysN LTQ |
 |
|---|
| TryLysC LTQ |
 |
|---|
| Try MSlow |
 |
|---|
| ChTry MSlow |
 |
|---|
| ArgC MSlow |
 |
|---|
| LysN MSlow |
 |
|---|
| TryLysC MSlow |
 |
|---|
| Try MShigh |
 |
|---|
| ChTry MShigh |
 |
|---|
| ArgC MShigh |
 |
|---|
| LysN MShigh |
 |
|---|
| TryLysC MShigh |
 |
|---|
General Statistics
Number of major isoforms |
Number of additional isoforms |
Number of all proteins |
Number of amino acids |
Min. Seq. Length |
Max. Seq. Length |
Avg. Seq. Length |
Avg. Mol. Weight |
|---|---|---|---|---|---|---|---|
0 |
1225219 |
38 |
4056 |
326.1 |
35.74 |
Amino acid frequency
Ala |
Cys |
Asp |
Glu |
Phe |
Gly |
His |
Ile |
Lys |
Leu |
|---|---|---|---|---|---|---|---|---|---|
11.293 ± 0.058 | 0.911 ± 0.01 |
5.932 ± 0.037 | 5.807 ± 0.035 |
3.535 ± 0.028 | 8.49 ± 0.044 |
2.343 ± 0.024 | 4.416 ± 0.034 |
2.936 ± 0.034 | 11.298 ± 0.058 |
Met |
Asn |
Gln |
Pro |
Arg |
Ser |
Thr |
Val |
Trp |
Tyr |
|---|---|---|---|---|---|---|---|---|---|
2.402 ± 0.022 | 2.843 ± 0.028 |
5.001 ± 0.033 | 4.052 ± 0.029 |
7.354 ± 0.049 | 5.231 ± 0.028 |
4.878 ± 0.033 | 7.343 ± 0.037 |
1.46 ± 0.017 | 2.475 ± 0.023 |
Most of the basic statistics you can see at this page can be downloaded from this CSV file
Proteome-pI is available under Creative Commons Attribution-NoDerivs license, for more details see here
| Reference: Kozlowski LP. Proteome-pI 2.0: Proteome Isoelectric Point Database Update. Nucleic Acids Res. 2021, doi: 10.1093/nar/gkab944 | Contact: Lukasz P. Kozlowski |
