candidate division MSBL1 archaeon SCGC-AAA385M02
Taxonomy: cellular organisms; Archaea; Euryarchaeota; Euryarchaeota incertae sedis; candidate division MSBL1
Average proteome isoelectric point is 6.83
Get precalculated fractions of proteins

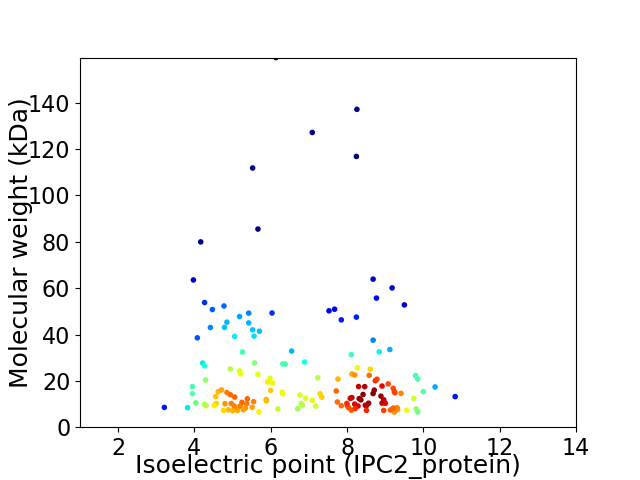
Virtual 2D-PAGE plot for 156 proteins (isoelectric point calculated using IPC2_protein)
Get csv file with sequences according to given criteria:
* You can choose from 21 different methods for calculating isoelectric point
Summary statistics related to proteome-wise predictions


Protein with the lowest isoelectric point:
>tr|A0A133VQA6|A0A133VQA6_9EURY Uncharacterized protein OS=candidate division MSBL1 archaeon SCGC-AAA385M02 OX=1698287 GN=AKJ59_00730 PE=4 SV=1
MM1 pKa = 6.63VTYY4 pKa = 10.26LPSSAQTSITIEE16 pKa = 4.05EE17 pKa = 4.85LEE19 pKa = 4.27VSTDD23 pKa = 3.6LTISAPISAVEE34 pKa = 4.13GEE36 pKa = 4.46SFSVSGILVRR46 pKa = 11.84VDD48 pKa = 3.04TGEE51 pKa = 4.83PIPNQTISITYY62 pKa = 9.0NGTAVGSGTTGVDD75 pKa = 2.85GDD77 pKa = 4.09YY78 pKa = 10.79LITISIPDD86 pKa = 4.07FGTYY90 pKa = 8.98TLTAEE95 pKa = 4.28FAGVSGLRR103 pKa = 11.84ASEE106 pKa = 3.93ARR108 pKa = 11.84SGISVGFIEE117 pKa = 4.73MPNWLNILVPLIVGTAVYY135 pKa = 10.62KK136 pKa = 11.01LGGGG140 pKa = 3.56
MM1 pKa = 6.63VTYY4 pKa = 10.26LPSSAQTSITIEE16 pKa = 4.05EE17 pKa = 4.85LEE19 pKa = 4.27VSTDD23 pKa = 3.6LTISAPISAVEE34 pKa = 4.13GEE36 pKa = 4.46SFSVSGILVRR46 pKa = 11.84VDD48 pKa = 3.04TGEE51 pKa = 4.83PIPNQTISITYY62 pKa = 9.0NGTAVGSGTTGVDD75 pKa = 2.85GDD77 pKa = 4.09YY78 pKa = 10.79LITISIPDD86 pKa = 4.07FGTYY90 pKa = 8.98TLTAEE95 pKa = 4.28FAGVSGLRR103 pKa = 11.84ASEE106 pKa = 3.93ARR108 pKa = 11.84SGISVGFIEE117 pKa = 4.73MPNWLNILVPLIVGTAVYY135 pKa = 10.62KK136 pKa = 11.01LGGGG140 pKa = 3.56
Molecular weight: 14.45 kDa
Isoelectric point according different methods:
Protein with the highest isoelectric point:
>tr|A0A133VR97|A0A133VR97_9EURY Uncharacterized protein OS=candidate division MSBL1 archaeon SCGC-AAA385M02 OX=1698287 GN=AKJ59_00070 PE=4 SV=1
MM1 pKa = 7.6SGNIYY6 pKa = 9.28DD7 pKa = 3.87TMKK10 pKa = 10.64SILGGGVPGSQPKK23 pKa = 10.35NGLIGGGANSNSSSGMEE40 pKa = 4.12GGQPRR45 pKa = 11.84GMEE48 pKa = 3.73RR49 pKa = 11.84SILRR53 pKa = 11.84RR54 pKa = 11.84AFNNQAIYY62 pKa = 9.92KK63 pKa = 9.91ANGGQKK69 pKa = 10.07HH70 pKa = 5.6SALNLAGKK78 pKa = 8.55ATLSFRR84 pKa = 11.84AAMNAGDD91 pKa = 4.16PLHH94 pKa = 7.45RR95 pKa = 11.84YY96 pKa = 7.2QQSCGGSNQVNNVRR110 pKa = 11.84RR111 pKa = 11.84SGSGVAKK118 pKa = 10.34SSVGGVSDD126 pKa = 4.27SNCKK130 pKa = 10.23KK131 pKa = 8.96STSFGGLVYY140 pKa = 10.16VTGKK144 pKa = 10.2DD145 pKa = 3.67VNPLQSGNHH154 pKa = 5.88RR155 pKa = 11.84YY156 pKa = 10.16VYY158 pKa = 10.52DD159 pKa = 3.92GSDD162 pKa = 3.18YY163 pKa = 11.45TRR165 pKa = 11.84FKK167 pKa = 11.02KK168 pKa = 10.35LASQNRR174 pKa = 11.84NYY176 pKa = 10.54NDD178 pKa = 3.23KK179 pKa = 11.39SFGGSNNGAYY189 pKa = 10.01SALNRR194 pKa = 11.84VRR196 pKa = 11.84RR197 pKa = 3.82
MM1 pKa = 7.6SGNIYY6 pKa = 9.28DD7 pKa = 3.87TMKK10 pKa = 10.64SILGGGVPGSQPKK23 pKa = 10.35NGLIGGGANSNSSSGMEE40 pKa = 4.12GGQPRR45 pKa = 11.84GMEE48 pKa = 3.73RR49 pKa = 11.84SILRR53 pKa = 11.84RR54 pKa = 11.84AFNNQAIYY62 pKa = 9.92KK63 pKa = 9.91ANGGQKK69 pKa = 10.07HH70 pKa = 5.6SALNLAGKK78 pKa = 8.55ATLSFRR84 pKa = 11.84AAMNAGDD91 pKa = 4.16PLHH94 pKa = 7.45RR95 pKa = 11.84YY96 pKa = 7.2QQSCGGSNQVNNVRR110 pKa = 11.84RR111 pKa = 11.84SGSGVAKK118 pKa = 10.34SSVGGVSDD126 pKa = 4.27SNCKK130 pKa = 10.23KK131 pKa = 8.96STSFGGLVYY140 pKa = 10.16VTGKK144 pKa = 10.2DD145 pKa = 3.67VNPLQSGNHH154 pKa = 5.88RR155 pKa = 11.84YY156 pKa = 10.16VYY158 pKa = 10.52DD159 pKa = 3.92GSDD162 pKa = 3.18YY163 pKa = 11.45TRR165 pKa = 11.84FKK167 pKa = 11.02KK168 pKa = 10.35LASQNRR174 pKa = 11.84NYY176 pKa = 10.54NDD178 pKa = 3.23KK179 pKa = 11.39SFGGSNNGAYY189 pKa = 10.01SALNRR194 pKa = 11.84VRR196 pKa = 11.84RR197 pKa = 3.82
Molecular weight: 20.75 kDa
Isoelectric point according different methods:
Peptides (in silico digests for buttom-up proteomics)
Below you can find in silico digests of the whole proteome with Trypsin, Chymotrypsin, Trypsin+LysC, LysN, ArgC proteases suitable for different mass spec machines.| Try ESI |
 |
|---|
| ChTry ESI |
 |
|---|
| ArgC ESI |
 |
|---|
| LysN ESI |
 |
|---|
| TryLysC ESI |
 |
|---|
| Try MALDI |
 |
|---|
| ChTry MALDI |
 |
|---|
| ArgC MALDI |
 |
|---|
| LysN MALDI |
 |
|---|
| TryLysC MALDI |
 |
|---|
| Try LTQ |
 |
|---|
| ChTry LTQ |
 |
|---|
| ArgC LTQ |
 |
|---|
| LysN LTQ |
 |
|---|
| TryLysC LTQ |
 |
|---|
| Try MSlow |
 |
|---|
| ChTry MSlow |
 |
|---|
| ArgC MSlow |
 |
|---|
| LysN MSlow |
 |
|---|
| TryLysC MSlow |
 |
|---|
| Try MShigh |
 |
|---|
| ChTry MShigh |
 |
|---|
| ArgC MShigh |
 |
|---|
| LysN MShigh |
 |
|---|
| TryLysC MShigh |
 |
|---|
General Statistics
Number of major isoforms |
Number of additional isoforms |
Number of all proteins |
Number of amino acids |
Min. Seq. Length |
Max. Seq. Length |
Avg. Seq. Length |
Avg. Mol. Weight |
|---|---|---|---|---|---|---|---|
0 |
33380 |
59 |
1385 |
214.0 |
24.57 |
Amino acid frequency
Ala |
Cys |
Asp |
Glu |
Phe |
Gly |
His |
Ile |
Lys |
Leu |
|---|---|---|---|---|---|---|---|---|---|
4.473 ± 0.317 | 1.372 ± 0.105 |
6.096 ± 0.174 | 7.397 ± 0.258 |
3.847 ± 0.14 | 6.093 ± 0.242 |
2.097 ± 0.112 | 7.313 ± 0.236 |
9.464 ± 0.35 | 7.442 ± 0.189 |
Met |
Asn |
Gln |
Pro |
Arg |
Ser |
Thr |
Val |
Trp |
Tyr |
|---|---|---|---|---|---|---|---|---|---|
2.927 ± 0.109 | 6.525 ± 0.26 |
3.4 ± 0.14 | 3.706 ± 0.179 |
4.158 ± 0.172 | 6.567 ± 0.198 |
5.512 ± 0.204 | 5.632 ± 0.17 |
1.174 ± 0.087 | 4.805 ± 0.156 |
Most of the basic statistics you can see at this page can be downloaded from this CSV file
Proteome-pI is available under Creative Commons Attribution-NoDerivs license, for more details see here
| Reference: Kozlowski LP. Proteome-pI 2.0: Proteome Isoelectric Point Database Update. Nucleic Acids Res. 2021, doi: 10.1093/nar/gkab944 | Contact: Lukasz P. Kozlowski |
