Rhinolophus blasii polyomavirus 2
Taxonomy: Viruses; Monodnaviria; Shotokuvirae; Cossaviricota; Papovaviricetes; Sepolyvirales; Polyomaviridae; unclassified Polyomaviridae
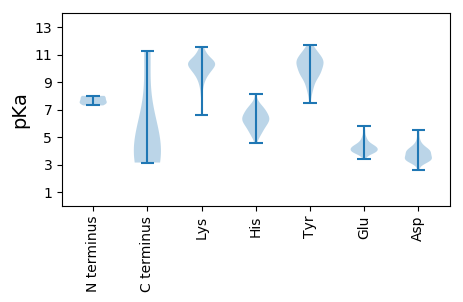
Average proteome isoelectric point is 6.69
Get precalculated fractions of proteins

Virtual 2D-PAGE plot for 6 proteins (isoelectric point calculated using IPC2_protein)
Get csv file with sequences according to given criteria:
* You can choose from 21 different methods for calculating isoelectric point
Summary statistics related to proteome-wise predictions


Protein with the lowest isoelectric point:
>tr|A0A223YUV1|A0A223YUV1_9POLY Minor capsid protein VP2 OS=Rhinolophus blasii polyomavirus 2 OX=2029303 GN=VP3 PE=3 SV=1
MM1 pKa = 7.47GGVLSIILDD10 pKa = 3.84LAEE13 pKa = 4.19ITTDD17 pKa = 3.24LSMSTGASVPLILSGEE33 pKa = 3.83AAAAVEE39 pKa = 4.48AEE41 pKa = 4.46VSSFMLLEE49 pKa = 4.28AMSPLEE55 pKa = 4.1ALAATGITTEE65 pKa = 4.18QFSLLHH71 pKa = 6.12AVPGMVLDD79 pKa = 3.99AVGLGMFFQTFTGASALVAAGLKK102 pKa = 10.33LGLSHH107 pKa = 6.54EE108 pKa = 4.44VSVVNQNMALTIWRR122 pKa = 11.84PEE124 pKa = 4.13EE125 pKa = 3.78YY126 pKa = 9.7WDD128 pKa = 3.52VLFPGVQTFAYY139 pKa = 8.75SLNVLGEE146 pKa = 4.13WATSIYY152 pKa = 10.4HH153 pKa = 6.38AVTRR157 pKa = 11.84QIWDD161 pKa = 3.43SLVRR165 pKa = 11.84EE166 pKa = 4.35GHH168 pKa = 5.1RR169 pKa = 11.84QIGRR173 pKa = 11.84VTSEE177 pKa = 3.5LAYY180 pKa = 10.31RR181 pKa = 11.84SAHH184 pKa = 5.81SFHH187 pKa = 7.02DD188 pKa = 4.22TIARR192 pKa = 11.84IVEE195 pKa = 3.83NARR198 pKa = 11.84WVLTTGPSHH207 pKa = 7.25IYY209 pKa = 9.88SHH211 pKa = 7.37LEE213 pKa = 3.9GYY215 pKa = 10.05YY216 pKa = 10.96SNLPGINPPQARR228 pKa = 11.84ALARR232 pKa = 11.84RR233 pKa = 11.84LQEE236 pKa = 4.67KK237 pKa = 10.37IPDD240 pKa = 3.84RR241 pKa = 11.84YY242 pKa = 8.33TMQRR246 pKa = 11.84EE247 pKa = 4.12SEE249 pKa = 4.29EE250 pKa = 3.99FSGEE254 pKa = 4.19LIEE257 pKa = 5.54HH258 pKa = 6.14VPPPGGAHH266 pKa = 5.71QRR268 pKa = 11.84VTPDD272 pKa = 2.59WLLPLILGLYY282 pKa = 10.46GDD284 pKa = 4.6ITPAWGQQLKK294 pKa = 8.42TLEE297 pKa = 4.19EE298 pKa = 4.4EE299 pKa = 3.91EE300 pKa = 5.19DD301 pKa = 4.0GPKK304 pKa = 10.17KK305 pKa = 9.64KK306 pKa = 10.15RR307 pKa = 11.84KK308 pKa = 8.07RR309 pKa = 11.84RR310 pKa = 11.84RR311 pKa = 11.84MLL313 pKa = 3.61
MM1 pKa = 7.47GGVLSIILDD10 pKa = 3.84LAEE13 pKa = 4.19ITTDD17 pKa = 3.24LSMSTGASVPLILSGEE33 pKa = 3.83AAAAVEE39 pKa = 4.48AEE41 pKa = 4.46VSSFMLLEE49 pKa = 4.28AMSPLEE55 pKa = 4.1ALAATGITTEE65 pKa = 4.18QFSLLHH71 pKa = 6.12AVPGMVLDD79 pKa = 3.99AVGLGMFFQTFTGASALVAAGLKK102 pKa = 10.33LGLSHH107 pKa = 6.54EE108 pKa = 4.44VSVVNQNMALTIWRR122 pKa = 11.84PEE124 pKa = 4.13EE125 pKa = 3.78YY126 pKa = 9.7WDD128 pKa = 3.52VLFPGVQTFAYY139 pKa = 8.75SLNVLGEE146 pKa = 4.13WATSIYY152 pKa = 10.4HH153 pKa = 6.38AVTRR157 pKa = 11.84QIWDD161 pKa = 3.43SLVRR165 pKa = 11.84EE166 pKa = 4.35GHH168 pKa = 5.1RR169 pKa = 11.84QIGRR173 pKa = 11.84VTSEE177 pKa = 3.5LAYY180 pKa = 10.31RR181 pKa = 11.84SAHH184 pKa = 5.81SFHH187 pKa = 7.02DD188 pKa = 4.22TIARR192 pKa = 11.84IVEE195 pKa = 3.83NARR198 pKa = 11.84WVLTTGPSHH207 pKa = 7.25IYY209 pKa = 9.88SHH211 pKa = 7.37LEE213 pKa = 3.9GYY215 pKa = 10.05YY216 pKa = 10.96SNLPGINPPQARR228 pKa = 11.84ALARR232 pKa = 11.84RR233 pKa = 11.84LQEE236 pKa = 4.67KK237 pKa = 10.37IPDD240 pKa = 3.84RR241 pKa = 11.84YY242 pKa = 8.33TMQRR246 pKa = 11.84EE247 pKa = 4.12SEE249 pKa = 4.29EE250 pKa = 3.99FSGEE254 pKa = 4.19LIEE257 pKa = 5.54HH258 pKa = 6.14VPPPGGAHH266 pKa = 5.71QRR268 pKa = 11.84VTPDD272 pKa = 2.59WLLPLILGLYY282 pKa = 10.46GDD284 pKa = 4.6ITPAWGQQLKK294 pKa = 8.42TLEE297 pKa = 4.19EE298 pKa = 4.4EE299 pKa = 3.91EE300 pKa = 5.19DD301 pKa = 4.0GPKK304 pKa = 10.17KK305 pKa = 9.64KK306 pKa = 10.15RR307 pKa = 11.84KK308 pKa = 8.07RR309 pKa = 11.84RR310 pKa = 11.84RR311 pKa = 11.84MLL313 pKa = 3.61
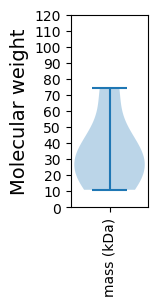
Molecular weight: 34.52 kDa
Isoelectric point according different methods:
Protein with the highest isoelectric point:
>tr|A0A223Z913|A0A223Z913_9POLY Capsid protein VP1 OS=Rhinolophus blasii polyomavirus 2 OX=2029303 GN=VP1 PE=3 SV=1
MM1 pKa = 7.3EE2 pKa = 4.89VSPGSSGGTTLTVDD16 pKa = 3.15GMTYY20 pKa = 10.19SVQRR24 pKa = 11.84TFRR27 pKa = 11.84AQTRR31 pKa = 11.84MDD33 pKa = 4.01LQAQALDD40 pKa = 3.39RR41 pKa = 11.84AMDD44 pKa = 4.02MIVDD48 pKa = 4.01SLAVHH53 pKa = 7.01RR54 pKa = 11.84APLQPPLNQKK64 pKa = 7.28SQKK67 pKa = 9.59QVMYY71 pKa = 11.12LMIFLLSFVASLVMLFILIRR91 pKa = 11.84QYY93 pKa = 11.72LPFF96 pKa = 5.99
MM1 pKa = 7.3EE2 pKa = 4.89VSPGSSGGTTLTVDD16 pKa = 3.15GMTYY20 pKa = 10.19SVQRR24 pKa = 11.84TFRR27 pKa = 11.84AQTRR31 pKa = 11.84MDD33 pKa = 4.01LQAQALDD40 pKa = 3.39RR41 pKa = 11.84AMDD44 pKa = 4.02MIVDD48 pKa = 4.01SLAVHH53 pKa = 7.01RR54 pKa = 11.84APLQPPLNQKK64 pKa = 7.28SQKK67 pKa = 9.59QVMYY71 pKa = 11.12LMIFLLSFVASLVMLFILIRR91 pKa = 11.84QYY93 pKa = 11.72LPFF96 pKa = 5.99
Molecular weight: 10.83 kDa
Isoelectric point according different methods:
Peptides (in silico digests for buttom-up proteomics)
Below you can find in silico digests of the whole proteome with Trypsin, Chymotrypsin, Trypsin+LysC, LysN, ArgC proteases suitable for different mass spec machines.| Try ESI |
 |
|---|
| ChTry ESI |
 |
|---|
| ArgC ESI |
 |
|---|
| LysN ESI |
 |
|---|
| TryLysC ESI |
 |
|---|
| Try MALDI |
 |
|---|
| ChTry MALDI |
 |
|---|
| ArgC MALDI |
 |
|---|
| LysN MALDI |
 |
|---|
| TryLysC MALDI |
 |
|---|
| Try LTQ |
 |
|---|
| ChTry LTQ |
 |
|---|
| ArgC LTQ |
 |
|---|
| LysN LTQ |
 |
|---|
| TryLysC LTQ |
 |
|---|
| Try MSlow |
 |
|---|
| ChTry MSlow |
 |
|---|
| ArgC MSlow |
 |
|---|
| LysN MSlow |
 |
|---|
| TryLysC MSlow |
 |
|---|
| Try MShigh |
 |
|---|
| ChTry MShigh |
 |
|---|
| ArgC MShigh |
 |
|---|
| LysN MShigh |
 |
|---|
| TryLysC MShigh |
 |
|---|
General Statistics
Number of major isoforms |
Number of additional isoforms |
Number of all proteins |
Number of amino acids |
Min. Seq. Length |
Max. Seq. Length |
Avg. Seq. Length |
Avg. Mol. Weight |
|---|---|---|---|---|---|---|---|
0 |
1813 |
96 |
645 |
302.2 |
34.23 |
Amino acid frequency
Ala |
Cys |
Asp |
Glu |
Phe |
Gly |
His |
Ile |
Lys |
Leu |
|---|---|---|---|---|---|---|---|---|---|
6.012 ± 0.737 | 1.986 ± 0.884 |
4.744 ± 0.454 | 7.06 ± 0.562 |
3.806 ± 0.471 | 6.233 ± 0.79 |
2.482 ± 0.518 | 4.633 ± 0.298 |
6.674 ± 1.515 | 10.204 ± 0.714 |
Met |
Asn |
Gln |
Pro |
Arg |
Ser |
Thr |
Val |
Trp |
Tyr |
|---|---|---|---|---|---|---|---|---|---|
3.365 ± 0.457 | 4.192 ± 0.949 |
5.847 ± 0.755 | 4.026 ± 0.541 |
4.688 ± 0.924 | 6.453 ± 0.417 |
5.571 ± 1.056 | 6.564 ± 0.713 |
1.765 ± 0.578 | 3.696 ± 0.333 |
Most of the basic statistics you can see at this page can be downloaded from this CSV file
Proteome-pI is available under Creative Commons Attribution-NoDerivs license, for more details see here
| Reference: Kozlowski LP. Proteome-pI 2.0: Proteome Isoelectric Point Database Update. Nucleic Acids Res. 2021, doi: 10.1093/nar/gkab944 | Contact: Lukasz P. Kozlowski |
