Lysobacter sp. Alg18-2.2
Taxonomy: cellular organisms; Bacteria; Proteobacteria; Gammaproteobacteria; Xanthomonadales; Xanthomonadaceae; Lysobacter; unclassified Lysobacter
Average proteome isoelectric point is 6.43
Get precalculated fractions of proteins

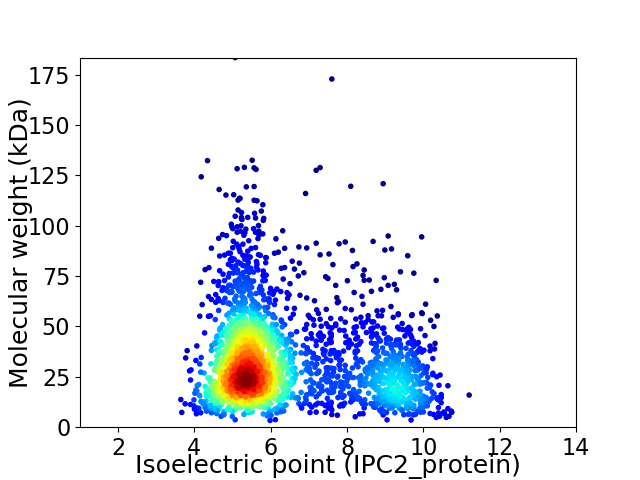
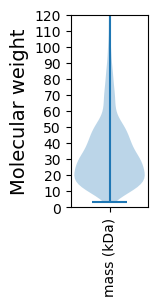
Virtual 2D-PAGE plot for 2448 proteins (isoelectric point calculated using IPC2_protein)
Get csv file with sequences according to given criteria:
* You can choose from 21 different methods for calculating isoelectric point
Summary statistics related to proteome-wise predictions


Protein with the lowest isoelectric point:
>tr|A0A5C8KKF6|A0A5C8KKF6_9GAMM DNA gyrase subunit A OS=Lysobacter sp. Alg18-2.2 OX=2603204 GN=gyrA PE=3 SV=1
MM1 pKa = 7.34LAAFVLMCTPALVAAQDD18 pKa = 3.66YY19 pKa = 11.1GNFEE23 pKa = 4.06IGAGFTPDD31 pKa = 3.51PQTGSGVSGGSVDD44 pKa = 3.82ASSFGPGCVGSVDD57 pKa = 4.4DD58 pKa = 5.43SPDD61 pKa = 2.94HH62 pKa = 6.96RR63 pKa = 11.84ITVTSTLDD71 pKa = 3.2LTLYY75 pKa = 10.76ALSSVDD81 pKa = 3.15TTLVLRR87 pKa = 11.84GPAGTFCDD95 pKa = 4.31DD96 pKa = 4.48DD97 pKa = 3.96SHH99 pKa = 8.05GGLNPEE105 pKa = 3.79INARR109 pKa = 11.84LTPGTYY115 pKa = 9.24EE116 pKa = 4.09VYY118 pKa = 10.67VGNFDD123 pKa = 3.93QDD125 pKa = 3.23DD126 pKa = 3.74QARR129 pKa = 11.84YY130 pKa = 7.9TLTLTEE136 pKa = 4.48NLGGTPGADD145 pKa = 3.16EE146 pKa = 4.23EE147 pKa = 4.7SGPRR151 pKa = 11.84TFSLGAGFLPDD162 pKa = 3.49PTIGRR167 pKa = 11.84GITGGDD173 pKa = 2.8MDD175 pKa = 4.86AARR178 pKa = 11.84FGAGCTGKK186 pKa = 9.68VHH188 pKa = 6.52VEE190 pKa = 3.74PDD192 pKa = 3.09HH193 pKa = 6.33VLTVTSAVNLHH204 pKa = 6.43MYY206 pKa = 10.05VDD208 pKa = 4.09SDD210 pKa = 3.37VDD212 pKa = 3.31ATLVVMGPQGAWCDD226 pKa = 3.73DD227 pKa = 3.87DD228 pKa = 6.43SNGNLDD234 pKa = 3.35PAIRR238 pKa = 11.84RR239 pKa = 11.84RR240 pKa = 11.84FPEE243 pKa = 4.27GVYY246 pKa = 10.09QIYY249 pKa = 10.12IGHH252 pKa = 7.42LGGDD256 pKa = 3.45AGRR259 pKa = 11.84YY260 pKa = 6.39TLTLTEE266 pKa = 4.68DD267 pKa = 3.93LEE269 pKa = 5.07DD270 pKa = 4.08FLL272 pKa = 6.87
MM1 pKa = 7.34LAAFVLMCTPALVAAQDD18 pKa = 3.66YY19 pKa = 11.1GNFEE23 pKa = 4.06IGAGFTPDD31 pKa = 3.51PQTGSGVSGGSVDD44 pKa = 3.82ASSFGPGCVGSVDD57 pKa = 4.4DD58 pKa = 5.43SPDD61 pKa = 2.94HH62 pKa = 6.96RR63 pKa = 11.84ITVTSTLDD71 pKa = 3.2LTLYY75 pKa = 10.76ALSSVDD81 pKa = 3.15TTLVLRR87 pKa = 11.84GPAGTFCDD95 pKa = 4.31DD96 pKa = 4.48DD97 pKa = 3.96SHH99 pKa = 8.05GGLNPEE105 pKa = 3.79INARR109 pKa = 11.84LTPGTYY115 pKa = 9.24EE116 pKa = 4.09VYY118 pKa = 10.67VGNFDD123 pKa = 3.93QDD125 pKa = 3.23DD126 pKa = 3.74QARR129 pKa = 11.84YY130 pKa = 7.9TLTLTEE136 pKa = 4.48NLGGTPGADD145 pKa = 3.16EE146 pKa = 4.23EE147 pKa = 4.7SGPRR151 pKa = 11.84TFSLGAGFLPDD162 pKa = 3.49PTIGRR167 pKa = 11.84GITGGDD173 pKa = 2.8MDD175 pKa = 4.86AARR178 pKa = 11.84FGAGCTGKK186 pKa = 9.68VHH188 pKa = 6.52VEE190 pKa = 3.74PDD192 pKa = 3.09HH193 pKa = 6.33VLTVTSAVNLHH204 pKa = 6.43MYY206 pKa = 10.05VDD208 pKa = 4.09SDD210 pKa = 3.37VDD212 pKa = 3.31ATLVVMGPQGAWCDD226 pKa = 3.73DD227 pKa = 3.87DD228 pKa = 6.43SNGNLDD234 pKa = 3.35PAIRR238 pKa = 11.84RR239 pKa = 11.84RR240 pKa = 11.84FPEE243 pKa = 4.27GVYY246 pKa = 10.09QIYY249 pKa = 10.12IGHH252 pKa = 7.42LGGDD256 pKa = 3.45AGRR259 pKa = 11.84YY260 pKa = 6.39TLTLTEE266 pKa = 4.68DD267 pKa = 3.93LEE269 pKa = 5.07DD270 pKa = 4.08FLL272 pKa = 6.87
Molecular weight: 28.44 kDa
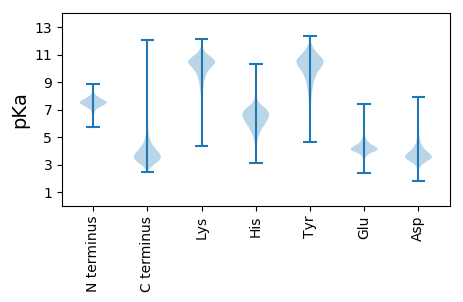
Isoelectric point according different methods:
Protein with the highest isoelectric point:
>tr|A0A5C8KQP2|A0A5C8KQP2_9GAMM TldD/PmbA family protein OS=Lysobacter sp. Alg18-2.2 OX=2603204 GN=FU658_09660 PE=3 SV=1
MM1 pKa = 7.04STDD4 pKa = 3.6SEE6 pKa = 4.41RR7 pKa = 11.84KK8 pKa = 9.82LPIVPIIIIVAAIVLFAIGWWRR30 pKa = 11.84GGARR34 pKa = 11.84PRR36 pKa = 11.84RR37 pKa = 11.84RR38 pKa = 11.84WSSSRR43 pKa = 11.84PSSRR47 pKa = 11.84NRR49 pKa = 11.84VIRR52 pKa = 11.84PPRR55 pKa = 11.84HH56 pKa = 5.39SASATRR62 pKa = 11.84RR63 pKa = 11.84GPAA66 pKa = 3.08
MM1 pKa = 7.04STDD4 pKa = 3.6SEE6 pKa = 4.41RR7 pKa = 11.84KK8 pKa = 9.82LPIVPIIIIVAAIVLFAIGWWRR30 pKa = 11.84GGARR34 pKa = 11.84PRR36 pKa = 11.84RR37 pKa = 11.84RR38 pKa = 11.84WSSSRR43 pKa = 11.84PSSRR47 pKa = 11.84NRR49 pKa = 11.84VIRR52 pKa = 11.84PPRR55 pKa = 11.84HH56 pKa = 5.39SASATRR62 pKa = 11.84RR63 pKa = 11.84GPAA66 pKa = 3.08
Molecular weight: 7.43 kDa
Isoelectric point according different methods:
Peptides (in silico digests for buttom-up proteomics)
Below you can find in silico digests of the whole proteome with Trypsin, Chymotrypsin, Trypsin+LysC, LysN, ArgC proteases suitable for different mass spec machines.| Try ESI |
 |
|---|
| ChTry ESI |
 |
|---|
| ArgC ESI |
 |
|---|
| LysN ESI |
 |
|---|
| TryLysC ESI |
 |
|---|
| Try MALDI |
 |
|---|
| ChTry MALDI |
 |
|---|
| ArgC MALDI |
 |
|---|
| LysN MALDI |
 |
|---|
| TryLysC MALDI |
 |
|---|
| Try LTQ |
 |
|---|
| ChTry LTQ |
 |
|---|
| ArgC LTQ |
 |
|---|
| LysN LTQ |
 |
|---|
| TryLysC LTQ |
 |
|---|
| Try MSlow |
 |
|---|
| ChTry MSlow |
 |
|---|
| ArgC MSlow |
 |
|---|
| LysN MSlow |
 |
|---|
| TryLysC MSlow |
 |
|---|
| Try MShigh |
 |
|---|
| ChTry MShigh |
 |
|---|
| ArgC MShigh |
 |
|---|
| LysN MShigh |
 |
|---|
| TryLysC MShigh |
 |
|---|
General Statistics
Number of major isoforms |
Number of additional isoforms |
Number of all proteins |
Number of amino acids |
Min. Seq. Length |
Max. Seq. Length |
Avg. Seq. Length |
Avg. Mol. Weight |
|---|---|---|---|---|---|---|---|
0 |
781265 |
31 |
1646 |
319.1 |
34.73 |
Amino acid frequency
Ala |
Cys |
Asp |
Glu |
Phe |
Gly |
His |
Ile |
Lys |
Leu |
|---|---|---|---|---|---|---|---|---|---|
12.476 ± 0.071 | 0.942 ± 0.017 |
5.796 ± 0.04 | 6.029 ± 0.047 |
3.401 ± 0.033 | 8.955 ± 0.044 |
2.411 ± 0.022 | 3.946 ± 0.035 |
2.098 ± 0.04 | 10.922 ± 0.073 |
Met |
Asn |
Gln |
Pro |
Arg |
Ser |
Thr |
Val |
Trp |
Tyr |
|---|---|---|---|---|---|---|---|---|---|
2.276 ± 0.022 | 2.177 ± 0.027 |
5.53 ± 0.039 | 3.435 ± 0.03 |
8.433 ± 0.057 | 5.244 ± 0.036 |
4.545 ± 0.032 | 7.776 ± 0.04 |
1.597 ± 0.021 | 2.01 ± 0.023 |
Most of the basic statistics you can see at this page can be downloaded from this CSV file
Proteome-pI is available under Creative Commons Attribution-NoDerivs license, for more details see here
| Reference: Kozlowski LP. Proteome-pI 2.0: Proteome Isoelectric Point Database Update. Nucleic Acids Res. 2021, doi: 10.1093/nar/gkab944 | Contact: Lukasz P. Kozlowski |
